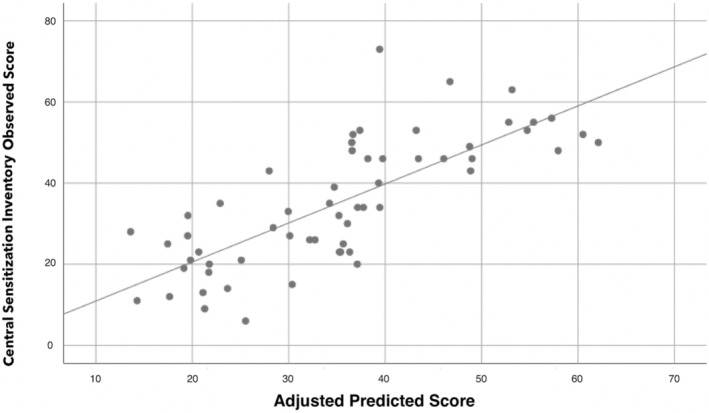
FIGURE 2.

Scatter plot of the adjusted predicted score (r 2 adjusted: 0.602) explaining Central Sensitization Inventory (CSI) score in COVID‐19 survivors exhibiting “de novo” post‐COVID pain symptoms (n = 77). Note that some points can be overlapping
