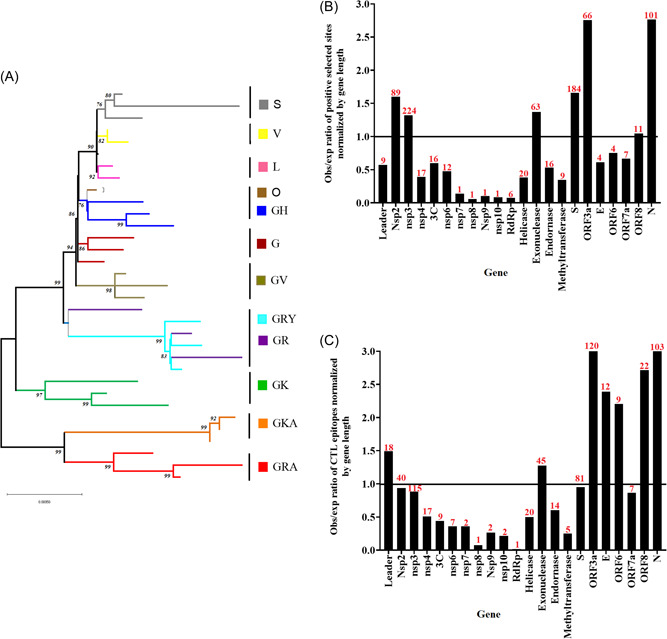
Figure 1.

Evolutionary profile of SARS‐CoV‐2 during the pandemic of COVID‐19. (A) Phylogenetic tree reconstructed by Maximum likelihood and the general time reversible model, illustrating the 14 clades (based on GISAID classification) predicted during the evolution of SARS‐CoV‐2. This tree was constructed using a total of 32 full‐length sequences representing different clades. Representative sequences were obtained from GISAID database (https://www.gisaid.org/). (B) Observed/expected ratio (obs/exp) of sites under positive selection at different genes sections of SARS‐CoV‐2 normalized by gene length. (C) obs/exp ratio of CTL epitopes at different gene sections of SARS‐CoV‐2 normalized by gene length. (Obs/exp = proportion of the total number of predicted positive selected sites or CTL epitopes found at specific genome sections/proportion of length at the overall coding region of SARS‐CoV‐2 represented by different gene sections). Red numbers on the bars represent the raw number of either sites under positive selection or CTL epitopes (predicted/validated) at different gene sections of SARS‐CoV‐2. Genes of SARS‐CoV‐2 where no information was available about sites under positive selection or epitopes were excluded from the graphics. The horizontal line at 1.0 indicate obs/exp values under the expected gene size. Information for (B) and (C) were obtained from the adaptive evolution server Datamonkey (https://observablehq.com/@spond/revised‐sars‐cov‐2‐analytics‐page). COVID‐19, coronavirus disease 2019; CTL, cytotoxic T lymphocyte; SARS‐CoV‐2, severe acute respiratory syndrome coronavirus 2.
