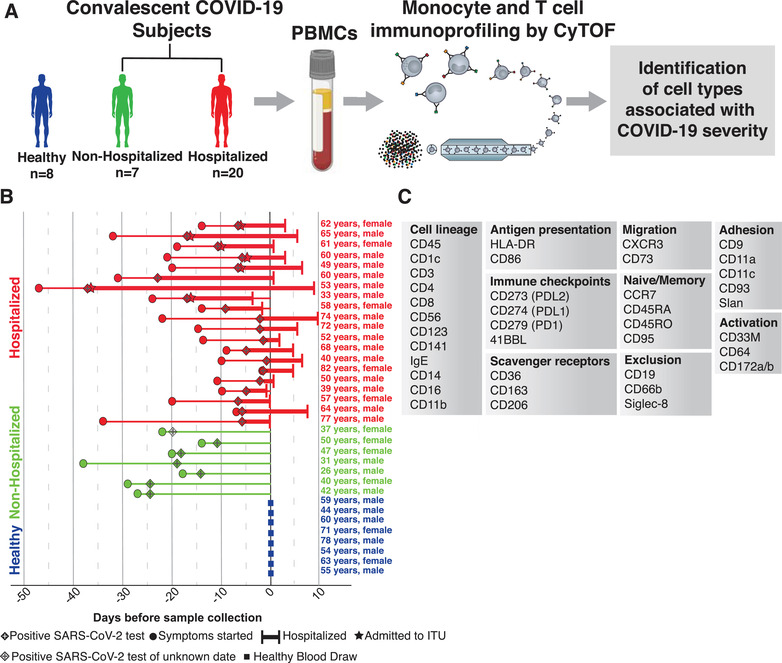
FIGURE 1.

Experimental layout. Flowchart of experimental design (A). Chart of every subject included in our analysis, with their condition (healthy, nonhospitalized, and hospitalized), age, sex, date of symptom onset, date of positive SARS‐CoV‐2 test, ITU status, span of hospital admission, and date of blood draw (B). List of markers used in immunoprofiling CyTOF panel grouped by their biologic roles (C)
