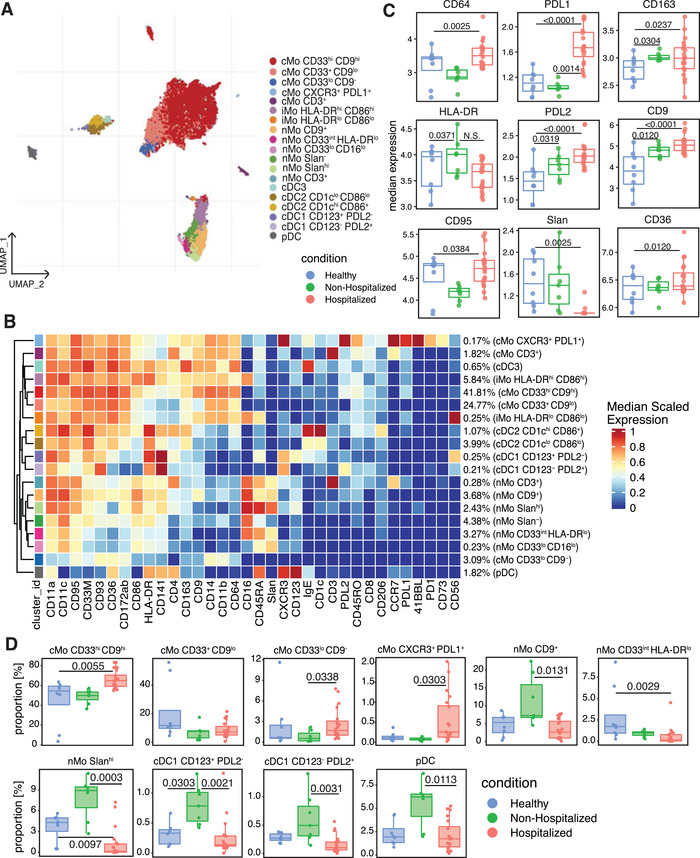
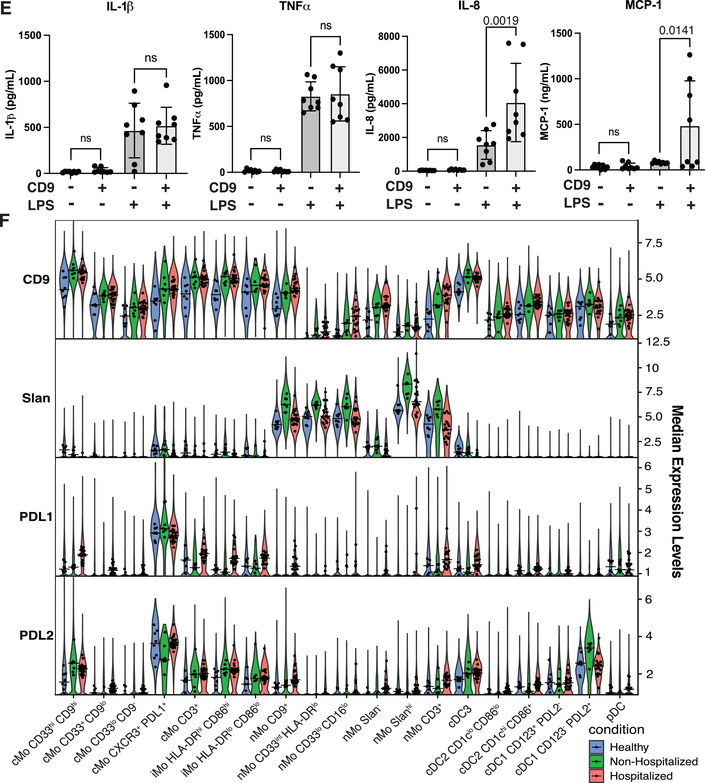
FIGURE 3.
Changes in monocyte and dendritic cell surface marker expression, subset frequencies and monocyte subset cytokine release in COVID‐19 subjects. Monocyte and dendritic cell clusters from Figure 2(A) were subclustered and displayed in their own UMAP (A). Heatmap displaying each subcluster's scaled median expression of 34 markers (B). Box and whisker plots showing median expression of cell surface markers within all monocytes and dendritic cells used in this subclustering analysis for healthy, nonhospitalized, and hospitalized subjects (C). Box and whisker plots of individual cell clusters as a proportion of all cells in this subclustering analysis between healthy, nonhospitalized, and hospitalized subjects (D). CD9+ and CD9– human monocytes were sorted from healthy human blood and 0.5 × 10⁶ monocytes were incubated with 100 ng/ml of LPS or vehicle control for 16 h. Cell supernatants were collected and used in Luminex analysis for cytokine release quantification (E). Stacked violin plots displaying median expression of CD9, Slan, PDL1, and PDL2 in healthy, nonhospitalized, and hospitalized subjects in each subcluster of monocytes and dendritic cells. The dots represent each individual's median expression levels and the black horizontal bars represent the median expression levels of each condition (F). Statistically significant (p ≤ 0.05) changes were calculated using adjusted p values generated after a multiple‐comparisons correction. Changes in cluster frequencies were calculated using GLMM, changes in marker expression were calculated with LIMMA and changes in cytokine release were calculated with one‐way ANOVA with a post hoc Tukey's test


