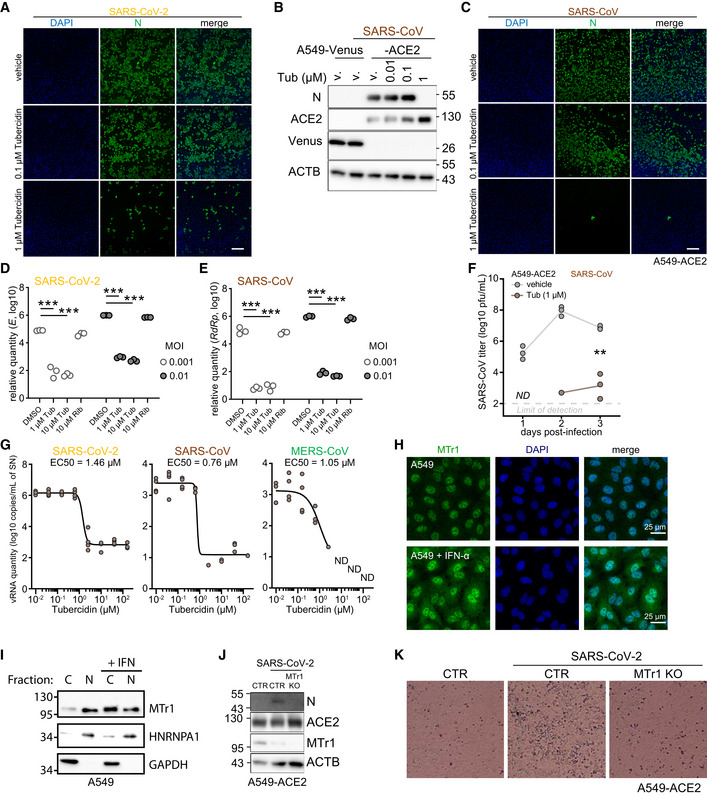
Figure EV1. In silico screening identified NSP16 inhibitors with potent anti‐SARS‐CoV‐2 activity.

-
ARepresentative images from three independent immunofluorescent analyses of A549‐ACE2 cells, pretreated for 3 h with indicated concentrations of Tubercidin or vehicle (DMSO) and infected with SARS‐CoV‐2 at MOI 0.5 at 24 h post‐infection. Immunostaining against the viral N protein is shown in green alongside DAPI staining in the blue channel. Scale bar: 250 μm.
-
BA549‐ACE2 or control cell line A549‐Venus were pretreated for 3 h with Tubercidin or vehicle (DMSO) and infected with SARS‐CoV at MOI 0.1. After 24 h, abundance of SARS‐CoV nucleoprotein (N), ACE2, Venus and β‐actin (ACTB, loading control) was visualized using Western blotting. Presented data is representative of three independent experiments.
-
CSimilar to (A), but the cells were infected with SARS‐CoV. Scale bar: 250 μm. Representative images from three independent immunofluorescent analyses.
-
D, EA549‐ACE2 cells pretreated for 3 h with vehicle (DMSO), Tubercidin or Ribavirin and infected with SARS‐CoV‐2 (D) or SARS‐CoV (E) at the indicated MOIs. At 24 h post infection, relative expression of SARS‐CoV‐2 E was quantified by RT‐qPCR. Statistics were calculated using Student's two‐sided t‐test between the three independent infections of the indicated conditions. The measurements are representative of three independent experiments. *** P < 0.001.
-
FA549‐ACE2 cells were pretreated for 3 h with Tubercidin or vehicle (DMSO) and infected with SARS‐CoV at MOI 0.01. At 1h post‐infection, medium change was performed. At the indicated days post infection, infectious viral progeny was quantified in the supernatant of n = 3 independently infected wells by plaque assay on Vero cells. The presented data is representative of two independent experiments. ND, not detected. Statistics were calculated using Student's two‐sided t‐test. ** P < 0.01.
-
GVero E6 cells expressing TMPRSS2 were pretreated for 3 h with the indicated concentration of Tubercidin and infected with SARS‐CoV‐2 (left), SARS‐CoV (middle) or MERS‐CoV (right) at MOI 0.1. At 1h post‐infection, medium change was performed. At 24 hours post‐infection, viral RNA in the supernatant of n = 4 independently infected wells was isolated and quantified using RT‐qPCR as a measure of virus replication. SARS‐CoV‐2 E, SARS‐CoV N, and MERS‐CoV N coding regions were targeted for quantification.
-
HA549 cells were treated with vehicle or IFN‐α at 500 U/ml overnight. The cells were fixed with 4% PFA and stained with anti‐MTr1 antibody and DAPI.
-
IA549 cells were treated with IFN‐β at 1,000 U/ml overnight followed by nucleo‐cytoplasmic fractionation. Quantification of MTr1, cytoplasmic marker GAPDH and nuclear marker hnRNP A1 was performed by Western blotting. Presented data is representative of three independent repeats.
-
JA549‐ACE2 CTR or MTr1 KO cell lines were infected with SARS‐CoV‐2 at MOI 0.1. After 24 h, abundances of viral nucleoprotein (N), ACE2, MTr1 and β‐actin (ACTB, loading control) were visualized using Western blotting. Presented data is representative of three independent experiments.
-
KRepresentative bright‐field images of A549‐ACE2 CTR and MTr1 KO cells infected with SARS‐CoV‐2 at MOI 0.01 at 72 h post‐infection. Images are representative of two independent experiments.
Source data are available online for this figure.
