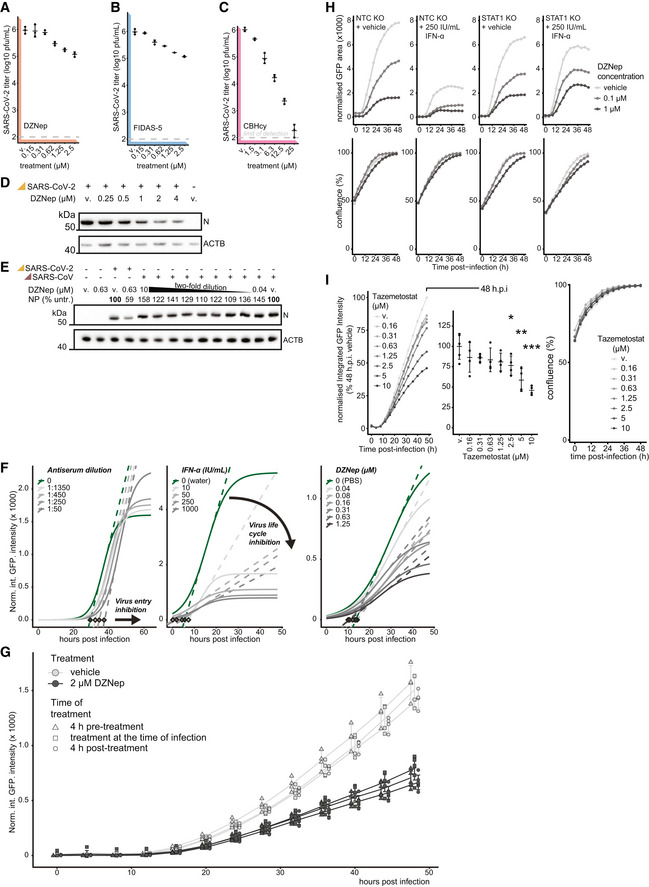
Figure EV3. SAM‐cycle inhibitor DZNep retains antiviral activity against SARS‐CoV‐2 in STAT1‐deficient cells.

-
A–CVero E6 cells were pretreated for 6 h with indicated concentrations of (A) DZNep, (B) FIDAS‐5 and (C) CBHcy, and infected with SARS‐CoV‐2 at MOI 0.01. 48 h post‐infection, produced infectious progeny was titrated on Vero E6 cells. Error bars correspond to mean ± SD of n = 3 independently infected wells.
-
DWestern blot showing abundances of SARS‐CoV‐2 nucleoprotein (N) and host β‐actin (ACTB, loading control) upon 6 h pretreatment of A549‐ACE2s with indicated concentrations of DZNep or vehicle (v., PBS) and infection with SARS‐CoV‐2 at MOI 3 for 24 h.
-
ESimilar to (D), with abundances of SARS‐CoV and SARS‐CoV‐2 N depicted alongside the percentage of N signal normalized to the vehicle‐treated sample (relative to loading control).
-
FA549‐ACE2 cells were pretreated for 6 h with indicated concentrations of DZNep (right), IFN‐α (middle) and infected with SARS‐CoV‐2‐GFP at MOI 3. Alternatively, the virus inoculum was incubated with indicated dilutions of antisera for 1 h at 37°C before use (left). Logistic curves, fitted to normalized integrated GFP intensity are depicted as measures of virus replication alongside maximum derivative at the inflection points (dashed lines) and respective linear regression intercepts with zero (diamonds). Depicted findings are based on 4 (DZNep), 2 (IFN‐α) and 12 (antisera) independently infected wells.
-
GA549‐ACE2 cells were treated with DZNep (2 μM) or vehicle (PBS) at 4 h prior to, at the time of, or 4 h post‐infection with SARS‐CoV‐2‐GFP at MOI 3. Normalized integrated GFP intensity is depicted as a measure of reporter virus replication. Plot depicts individual measurements (offset for clarity) alongside mean ± SD of 6 (DZNep) or 4 (vehicle) independently infected wells.
-
HSTAT1 KO or NTC A549‐ACE2 cells were pretreated for 6 h with the indicated concentration of interferon α (IFN‐α), DZNep or PBS (vehicle), and infected with SARS‐CoV‐2‐GFP at MOI 3. Normalized GFP area is plotted over time as a measure of reporter virus growth. Data shows mean of three independently infected wells and is representative of three independent repeats.
-
IA549‐ACE2 cells were pretreated for 6 h with indicated concentrations of Tazemetostat and infected with SARS‐CoV‐2‐GFP at MOI 3. Normalized integrated GFP intensity is plotted over time (left) and at 48 h post‐infection (right) as a measure of reporter virus growth. Means of four independently infected wells (left) and means ± SD (right) are depicted. Statistics were calculated using Student's two‐sided t‐test between indicated treatment concentrations and vehicle control (v., DMSO). * P < 0.05, ** P < 0.01, *** P < 0.001.
Source data are available online for this figure.
