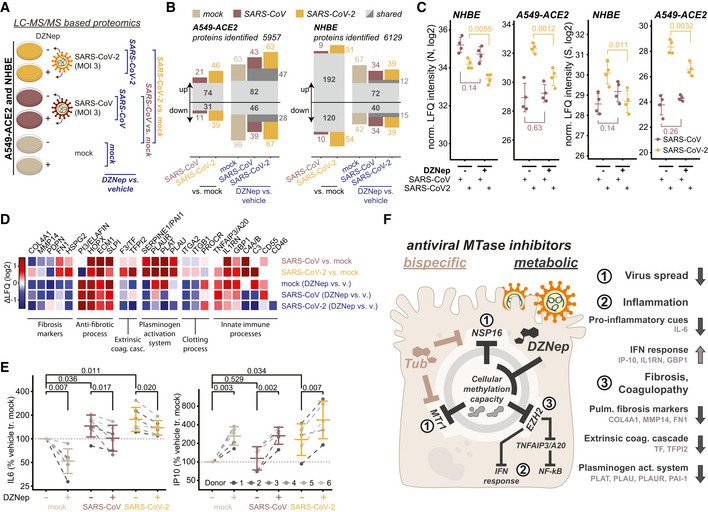
Mass spectrometry‐based analysis of cells treated with DZNep and infected with SARS‐CoV‐2 and SARS‐CoV. (A) Schematic representation of LC–MS/MS experiments. A549‐ACE2s and NHBEs were pretreated for 6 h with 0.75 and 1.5 μM DZNep, respectively, or vehicle (PBS), and infected with SARS‐CoV‐2 or SARS‐CoV at MOI 3 for 24 h (A549‐ACE2) or 36 h (NHBEs). Changes in protein abundance were analyzed according to the depicted scheme using LASSO‐based linear model followed by fixed LASSO inference‐based p‐value estimation as described in the
Materials and Methods section. (B) Number of significantly up‐ or downregulated proteins in indicated comparisons according to (A). (C) Donor‐normalized LFQ abundance of viral nucleoprotein (N) and spike (S) in the indicated conditions. Error bars represent mean ± SD of
n = 4 donors (NHBE) or
n = 4 independently infected A549‐ACE2 cultures. Statistics were calculated using Student's two‐sided
t‐test as indicated. (D) Expression patterns according to (A) of a selection of genes related to the disease‐relevant pathways as annotated.

