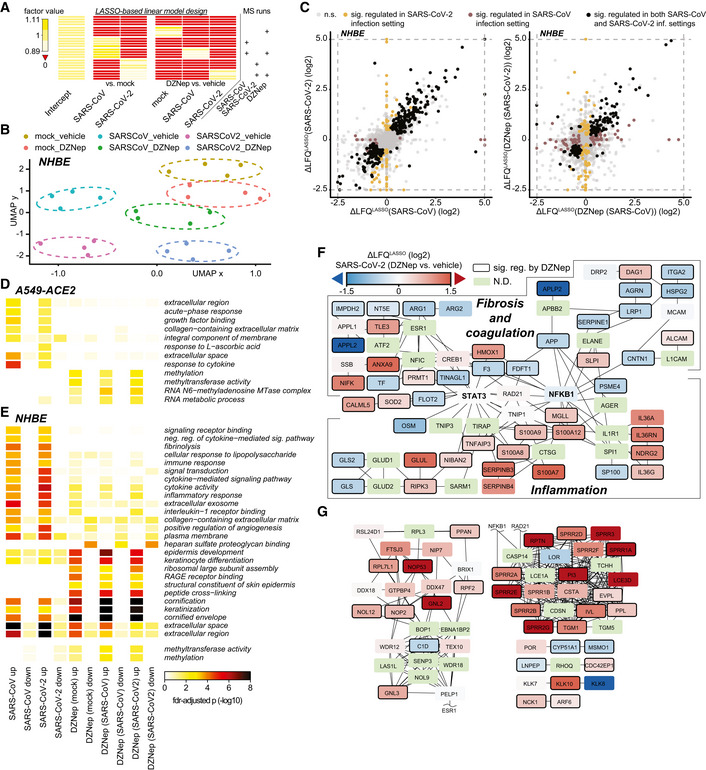
Figure EV4. DZNep treatment modulates tissue and immune processes.

-
AExperimental design matrix used for LASSO‐based linear model depicting relationship between MS runs (samples) and coefficients in the model. Values of factors, used in the modeling approach and shown in the heatmap, were calculated as described in Materials and Methods.
-
BUMAP dimensionality reduction, applied to normalized LFQ protein abundances of DZNep‐ or vehicle‐treated and SARS‐CoV, SARS‐CoV‐2 or mock‐infected NHBEs.
-
CScatterplots depicting the relationship between SARS‐CoV‐2 and SARS‐CoV induced protein changes relative to mock‐infection (left) and DZNep induced protein changes in the context of SARS‐CoV‐2 and SARS‐CoV infection (right) of NHBEs. LASSO‐based log2 fold‐changes are depicted. n.s., not significant.
-
D, EHeatmap depicting GO‐terms, enriched in at least two comparisons (columns) of A549 (D) or NHBE (E) proteome analyses at fdr‐adjusted P‐values < 0.025 and < 0.001, respectively. For NHBEs, the thresholds do not apply to the methylation‐related (bottom two) terms. Statistics were calculated using Fisher exact test with FDR‐based P‐value adjustment.
-
F, GProteins, differentially expressed upon DZNep treatment of NHBEs in the contexts of SARS‐CoV and SARS‐CoV‐2 infections were used for network diffusion analysis in order to identify genes functionally interacting with them. (F) The graph shows a cluster of genes found to be significantly enriched in this analysis and that was related to fibrosis and coagulation, and inflammation. (G) Sections of significant genes from network diffusion analysis of DZNep‐regulated proteins outside the fibrosis and inflammation related cluster (F). The networks are overlaid with LASSO‐based log2 fold change between SARS‐CoV‐2 infected DZNep‐ and vehicle‐treated NHBEs. N.D., not detected.
