
FIGURE 3.
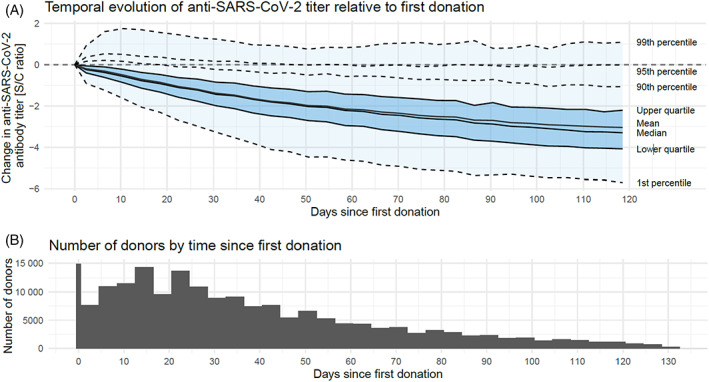
Temporal evolution of anti‐SARS‐CoV‐2 antibody levels. (A) Change of anti‐SARS‐CoV‐2 titer over time relative to the first donation and out to 120 days after the first donation. Assessing titers beyond 120 days resulted in a significant reduction in donor numbers and thus too small a cohort for meaningful analyses. The distribution of the change in anti‐SARS‐CoV‐2 titer across the donor population is displayed by quantiles, with the inner 98% of the distribution shaded in light blue and the central 50% in darker blue. (B) The number of donors with donations after X days since the first donation