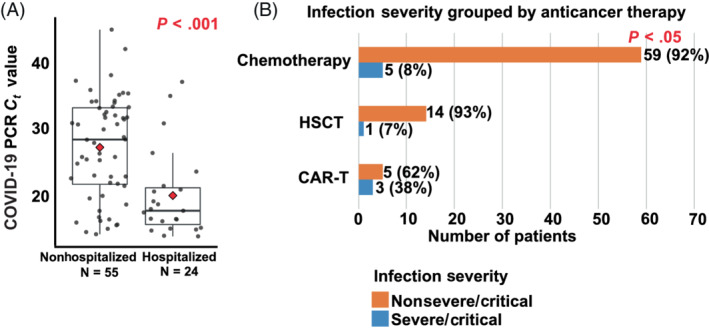
FIGURE 2.

Associations between COVID‐19 outcomes and COVID‐19 PCR cycle threshold value or type of anticancer therapy. (A) Cycle threshold value for diagnostic COVID‐19 PCR in children, adolescents and young adults (AYA) with cancer and COVID‐19 infection grouped by need for COVID‐19 related hospitalization (PCR cycle threshold value data available for 79 patients). Red diamond: mean. Two‐sided t test P value shown. Each data‐point represents an individual patient (B) COVID‐19 infection severity grouped by type of anticancer therapy. P value: Two‐sided Fisher exact test P value for a comparison of the three groups testing for a difference between at least two of the three groups
