
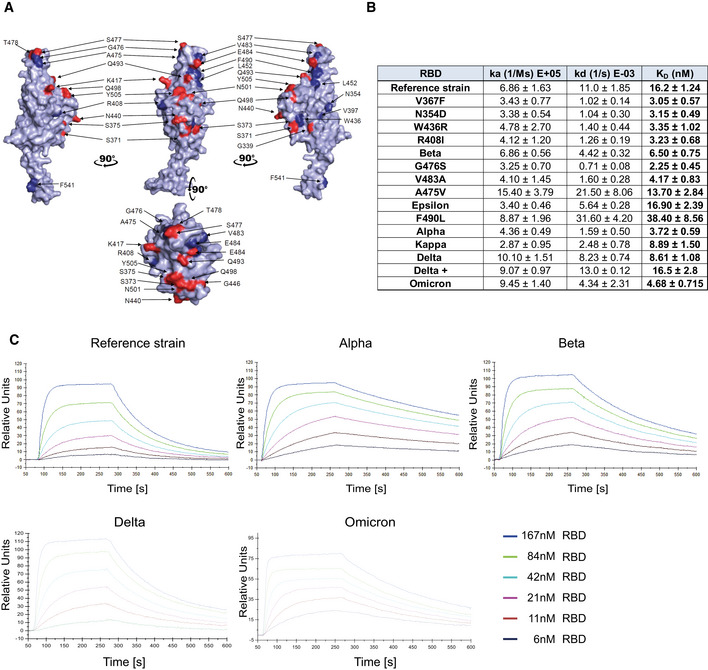
Figure 1. Increased affinity of APN01 interactions with SARS‐CoV‐2‐RBD variants.
-
APyMOL rendered visualization of the SARS‐CoV‐2 RBD. Rendering depicts the SARS‐CoV‐2 RBD from the Wuhan reference isolate with mutation sites observed in SARS‐CoV‐2 variants shown in red. Indicated in blue are positions mutated in the various strains of SARS‐CoV‐2 used in experiments in this study.
-
BSurface Plasmon Resonance analysis to derive kinetic constants (ka, kd) and affinity values (KD) of SARS‐CoV‐2 RBD/APN01 interaction. The constants represent mean values and standard deviations obtained from sensorgram fittings performed in quadruplicate. The table lists both the tested variants and the introduced amino acid substitution as well as the designation of the respective Variant of Concern (VOC) or Variant of Interest (VOI) mutations tested in this study. Reference strain RBD sequence corresponds to the Wuhan SARS‐CoV‐2 isolate.
-
CRepresentative SPR sensorgram images for the SARS‐CoV‐2 RBD/APN01 interaction of current VOCs.