
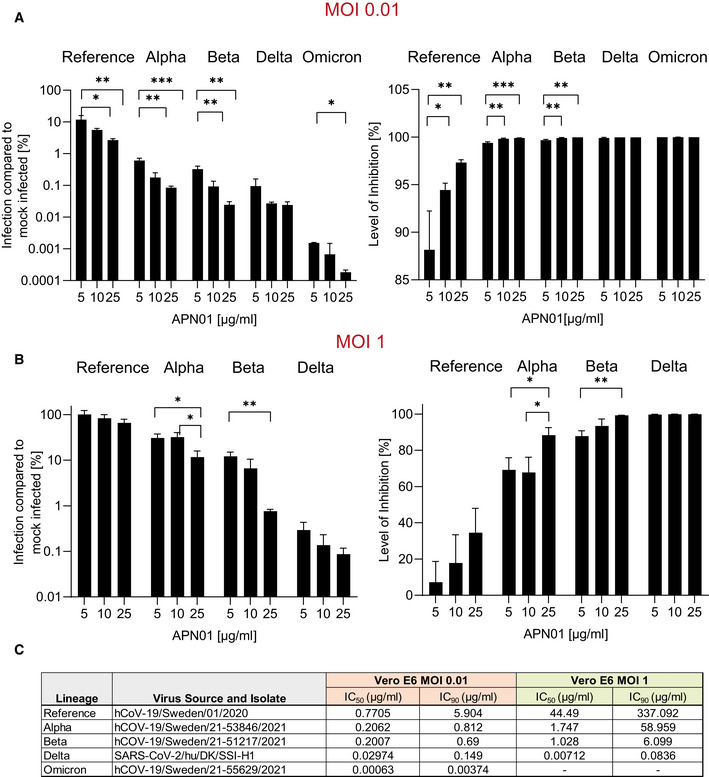
Figure 4. Increased potency of APN01 against SARS‐CoV‐2 VOC.
-
A, BDiagrams depict the level of infection with the indicated SARS‐CoV‐2 isolates at MOI 0.01 (A) and MOI 1 (B) of VeroE6 cells after pre‐incubation with increasing concentrations of APN01 as compared to infections in the absence of APN01 pre‐incubation. MOIs as depicted reflect multiplicities of infection before the pre‐incubation with APN01 that was followed by the viral infection of cells. Shown are means of biological replicates (n = 3) analyses with standard deviations. Statistical significance is indicated by asterisks (*P‐value < 0.05; **P‐value < 0.01, ***P‐value < 0.001 as calculated with one‐way ANOVA).
-
CList and source of strains used at the Karolinska Institutet and IC50 and IC90 values obtained for the indicated MOIs. See Materials and Methods section for a detailed list of viral mutations for the strains used.