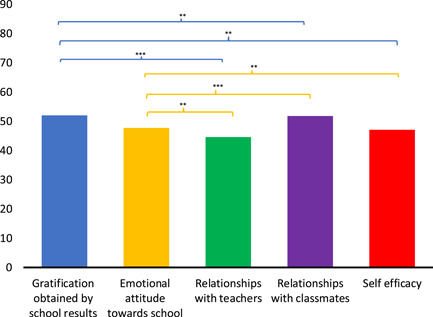
Figure 1.

Junior Students School Wellbeing. The graph evidences the differences between QBS scales. Significant differences between QBS scales emerging from post hoc Duncan's test are indicated (*p ≤ 0.05; **p ≤ 0.01; ***p ≤ 0.001). Bars describe means, and error bars describe standard deviations
