
FIGURE 1.
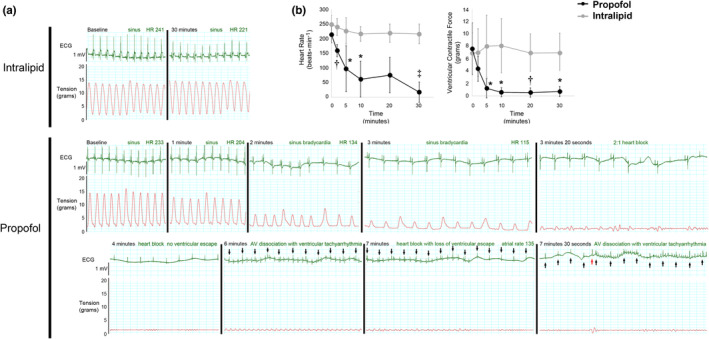
Propofol impairs heart rate, cardiac rhythm, and ventricular contractile force. (a) Representative tracings of surface electrocardiogram (ECG) and ventricular contractile force (tension) over time. Tracings captured prior to exposure (baseline) and at various time points during exposure are depicted. Heart rate (HR) is provided in beats per minute. Black arrows indicate P waves in the propofol‐exposed ECG tracing while the red arrow indicates a dissociated ventricular beat. (b) Heart rate and ventricular contractile force over time. Values are means ± SD. n = 6–8 per group. p values were calculated by two‐way ANOVA with repeated measures. *p < 0.05, † p < 0.01, ‡ p < 0.001 versus time‐matched intralipid values.