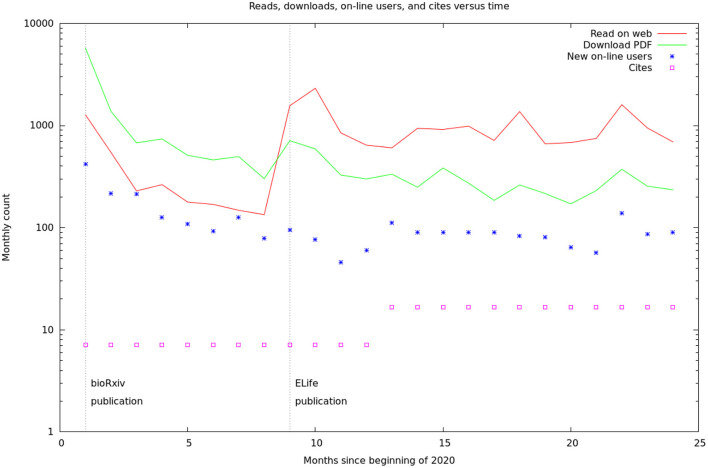
Figure 5.
Relative rates of readership, database access, and cites. The readership and download rates are the sum of the figures from the bioχivand eLifesites. The database access rates are from our logs. The citation rates are from Google scholar, but are only shown yearly and have been converted to monthly rates for this graph. The vertical lines are the initial BioRxiv publication (Xu et al., 2020) and the formal, peer-reviewed eLifearticle (Scheffer et al., 2020).

