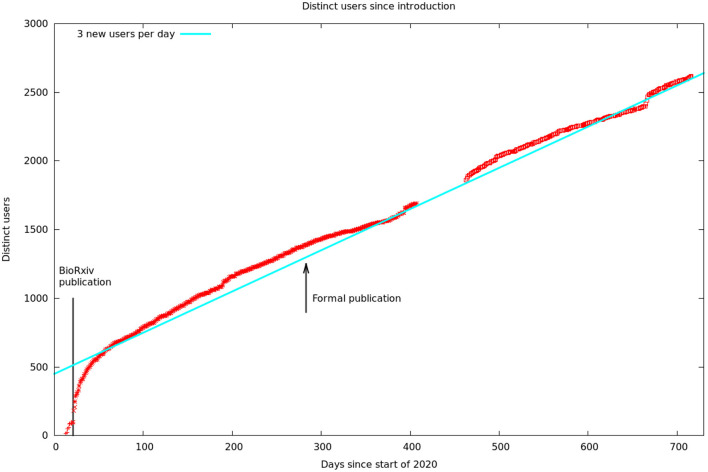
Figure 6.
Cumulative unique visitors. The solid line is a hypothetical rate of three new users per day. We assumed this rate during our data gap, as this is consistent with the rest of our data. The solid line to the left is the date of publication of the first bioχivpaper. The arrow shows the later formal publication in eLifethat contained better cell typing, analysis, and discussion.

