Figure.
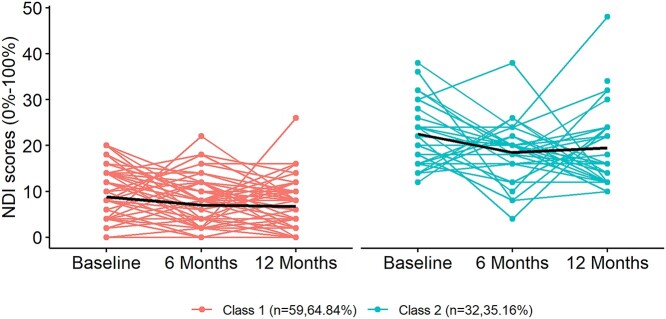
Identified trajectories of neck disability as measured with the Neck Disability Index (NDI). The y-axis represents NDI scores, and the x-axis represents the 3 time points over 12 months. The red and green lines represent individual trajectories within class 1 (low-resolving disability) and class 2 (moderate-fluctuating disability), respectively. The black line within each class represents the mean trajectories.

