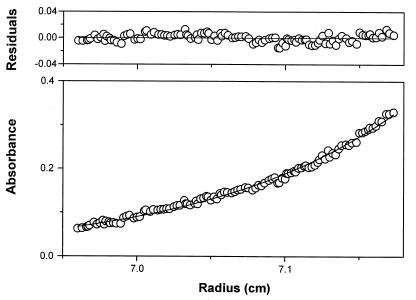
FIG. 4.
Concentration distribution of BADH during sedimentation equilibrium. The circles are measured values in a standard two-sector ultracentrifuge cell. The solid line is the result of fitting the data with a single-ideal-species model by using the nonlinear regression program NONLIN and equation 1. The residuals to the fit are shown in the top panel.

