
Figure 4.
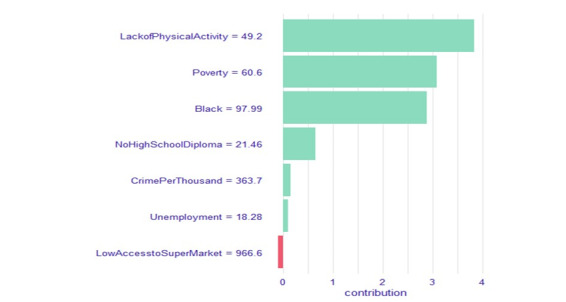
The Shapley Additive Explanations (SHAP) value plot of the feature contribution (unscaled) for the patient’s neighborhood (census tract:10300). The x-axis represents the SHAP’s value, and the y-axis represents the features. The lack of physical activity and poverty had the largest positive (increase) contributions to obesity prevalence in the patient’s neighborhood.