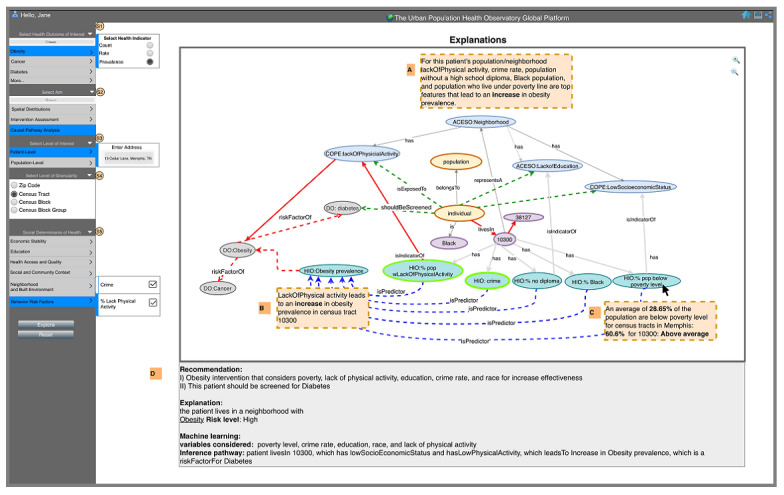
Figure 5.

The dashboard of the Urban Population Health Observatory displays a physician user interested in obesity prevalence in her patient’s neighborhood with an overview of analysis results (A), explanations displayed when user hovers over a particular pathway (B), knowledge displayed when user hovers over a particular node (C), and summary of recommendations and knowledge (D). ACESO: adverse childhood experiences ontology; GISO: geographical information system ontology; DO: disease ontology; HIO: health indicators ontology.
