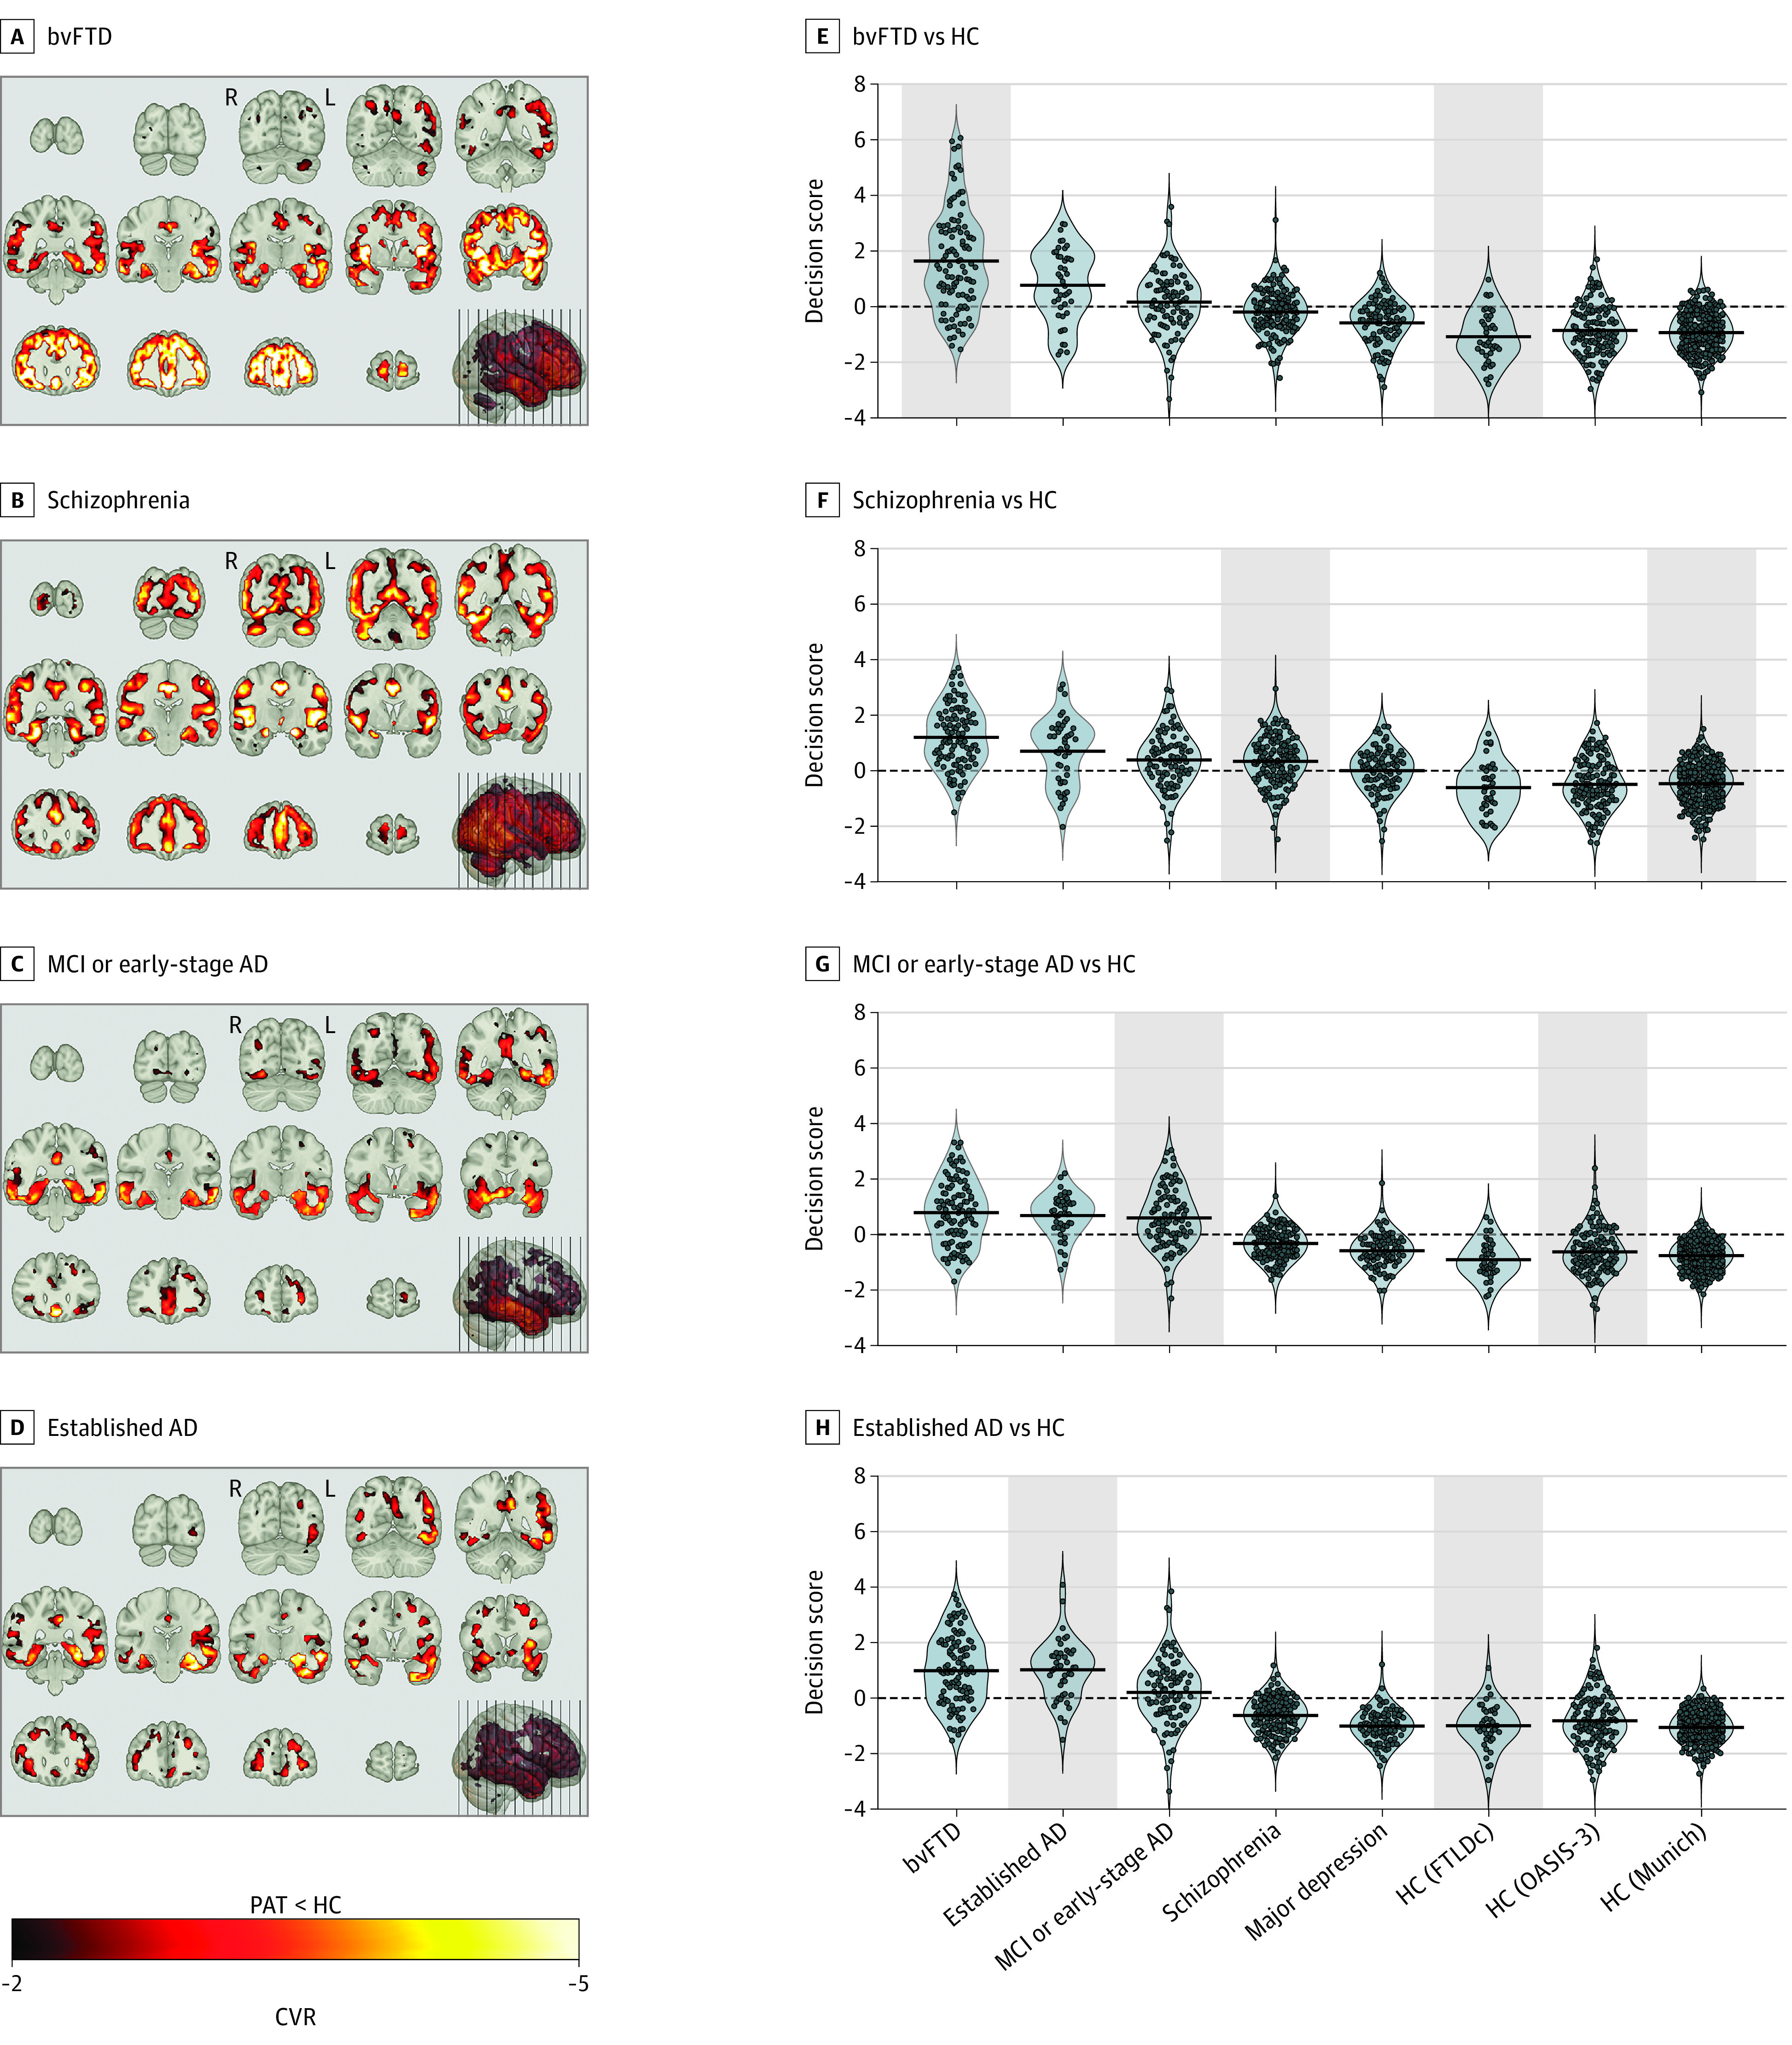
Figure 1. Classifier Signatures, Pattern Score Distributions, and Predicted Case Label Probabilities of Patient (PAT) and Healthy Control (HC) Samples.

A-D, Cross-validation ratio (CVR) (eMethods in Supplement 1) maps overlaid on the MNI single-individual neuroanatomical template indicate patterns of reliable volume reductions (from top to bottom) in the 4 patient samples vs HC. E-H, Violin plots of pattern score distributions produced by the cross-validated within-group application of classification models (gray background) or the crossover application of models to the other diagnostic groups. Decision score refers to the mean output across all support-vector machine classifiers in the given classification analysis produced for the patients/controls in the given sample. Additionally, the Table describes each study group’s probability of being assigned to the respective patient class by the respective classifier. AD indicates Alzheimer disease; bvFTD, behavioral-variant frontotemporal dementia; MCI, mild cognitive impairment; FTLDc, the German Frontotemporal Lobar Degeneration Consortium.
