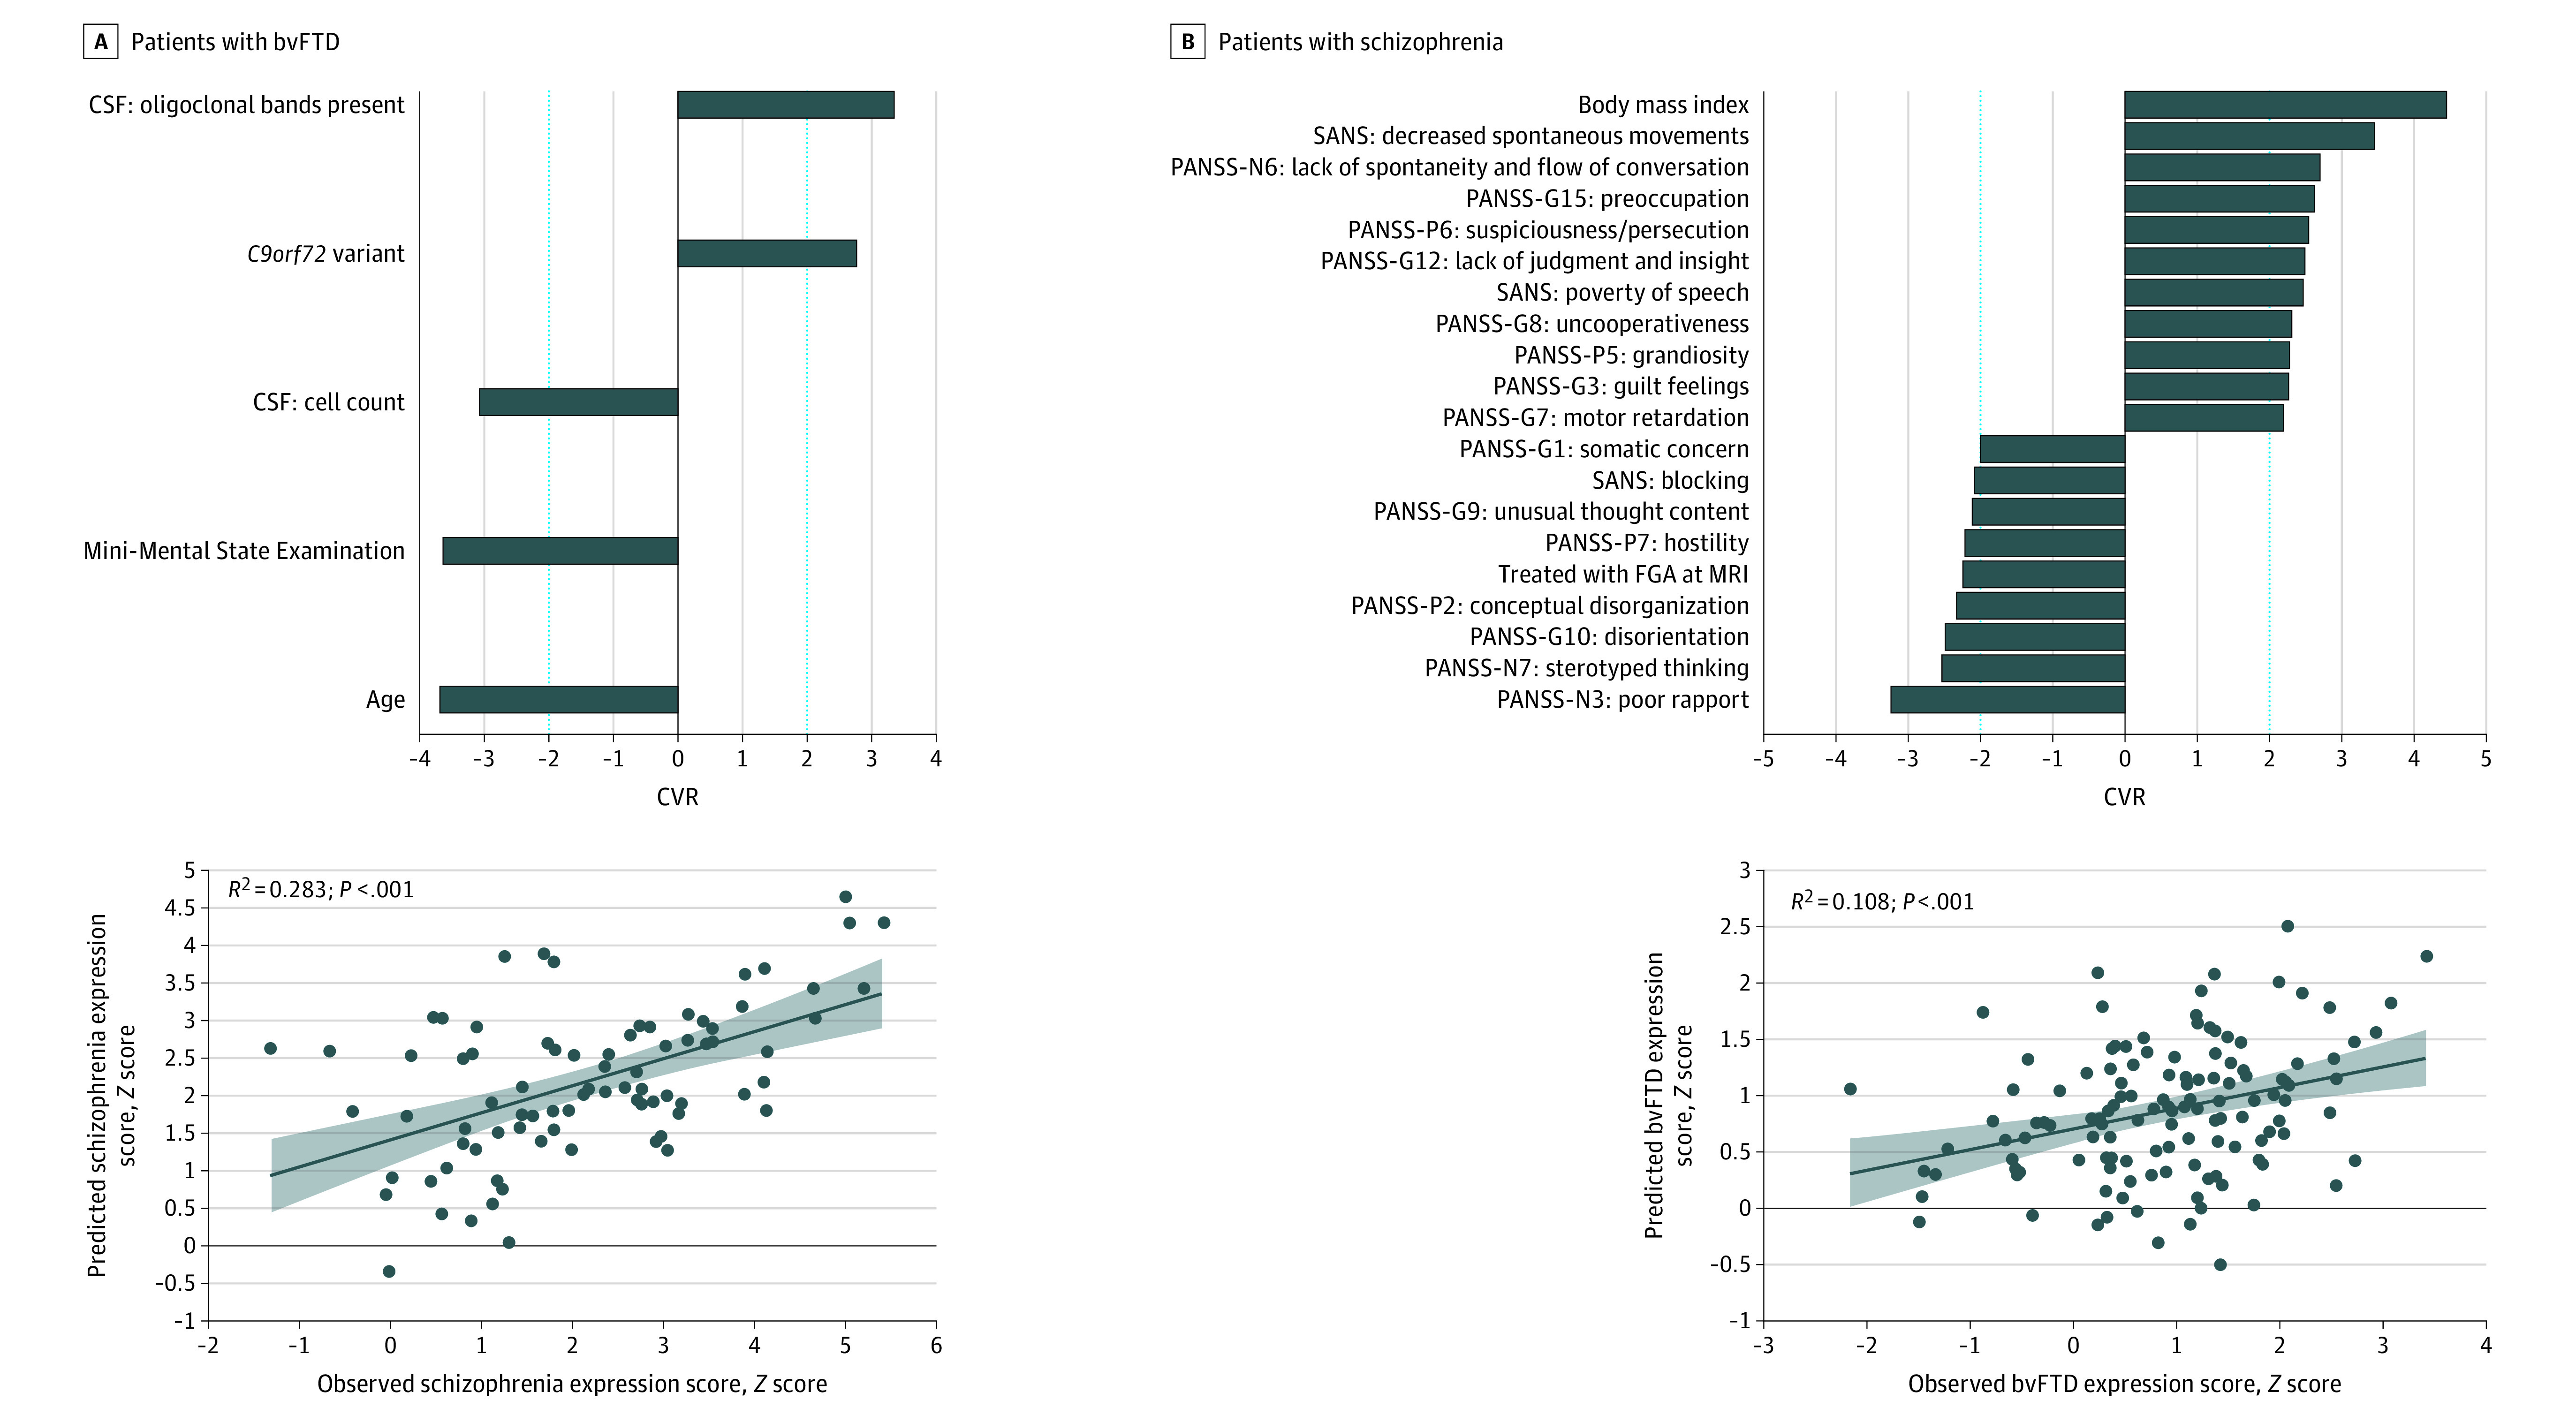
Figure 2. Support-Vector Regression Models Predicting the Neuroanatomical Expression of the Schizophrenia Signature in Patients With Behavioral-Variant Frontotemporal Dementia (bvFTD) and the bvFTD Signature in Patients With Schizophrenia.

Bar plots show the ranked reliability (cross-validation ratio [CVR]) (eMethods in Supplement 1) of features informing the support-vector regression models’ predictions at |CVR| ≥ 2. Positive and negative CVR values indicate positive and negative predictive associations between features and observed scores. Scatterplots with linear fits, 95% CIs, and coefficients of determination (R2) describe the accuracy of the respective models in predicting neuroanatomical expression scores. CSF indicates cerebrospinal fluid; FGA, first-generation antipsychotics; MRI, magnetic resonance imaging; PANSS, Positive and Negative Symptom Scale; SANS, Scale for Assessment of Negative Symptoms.
