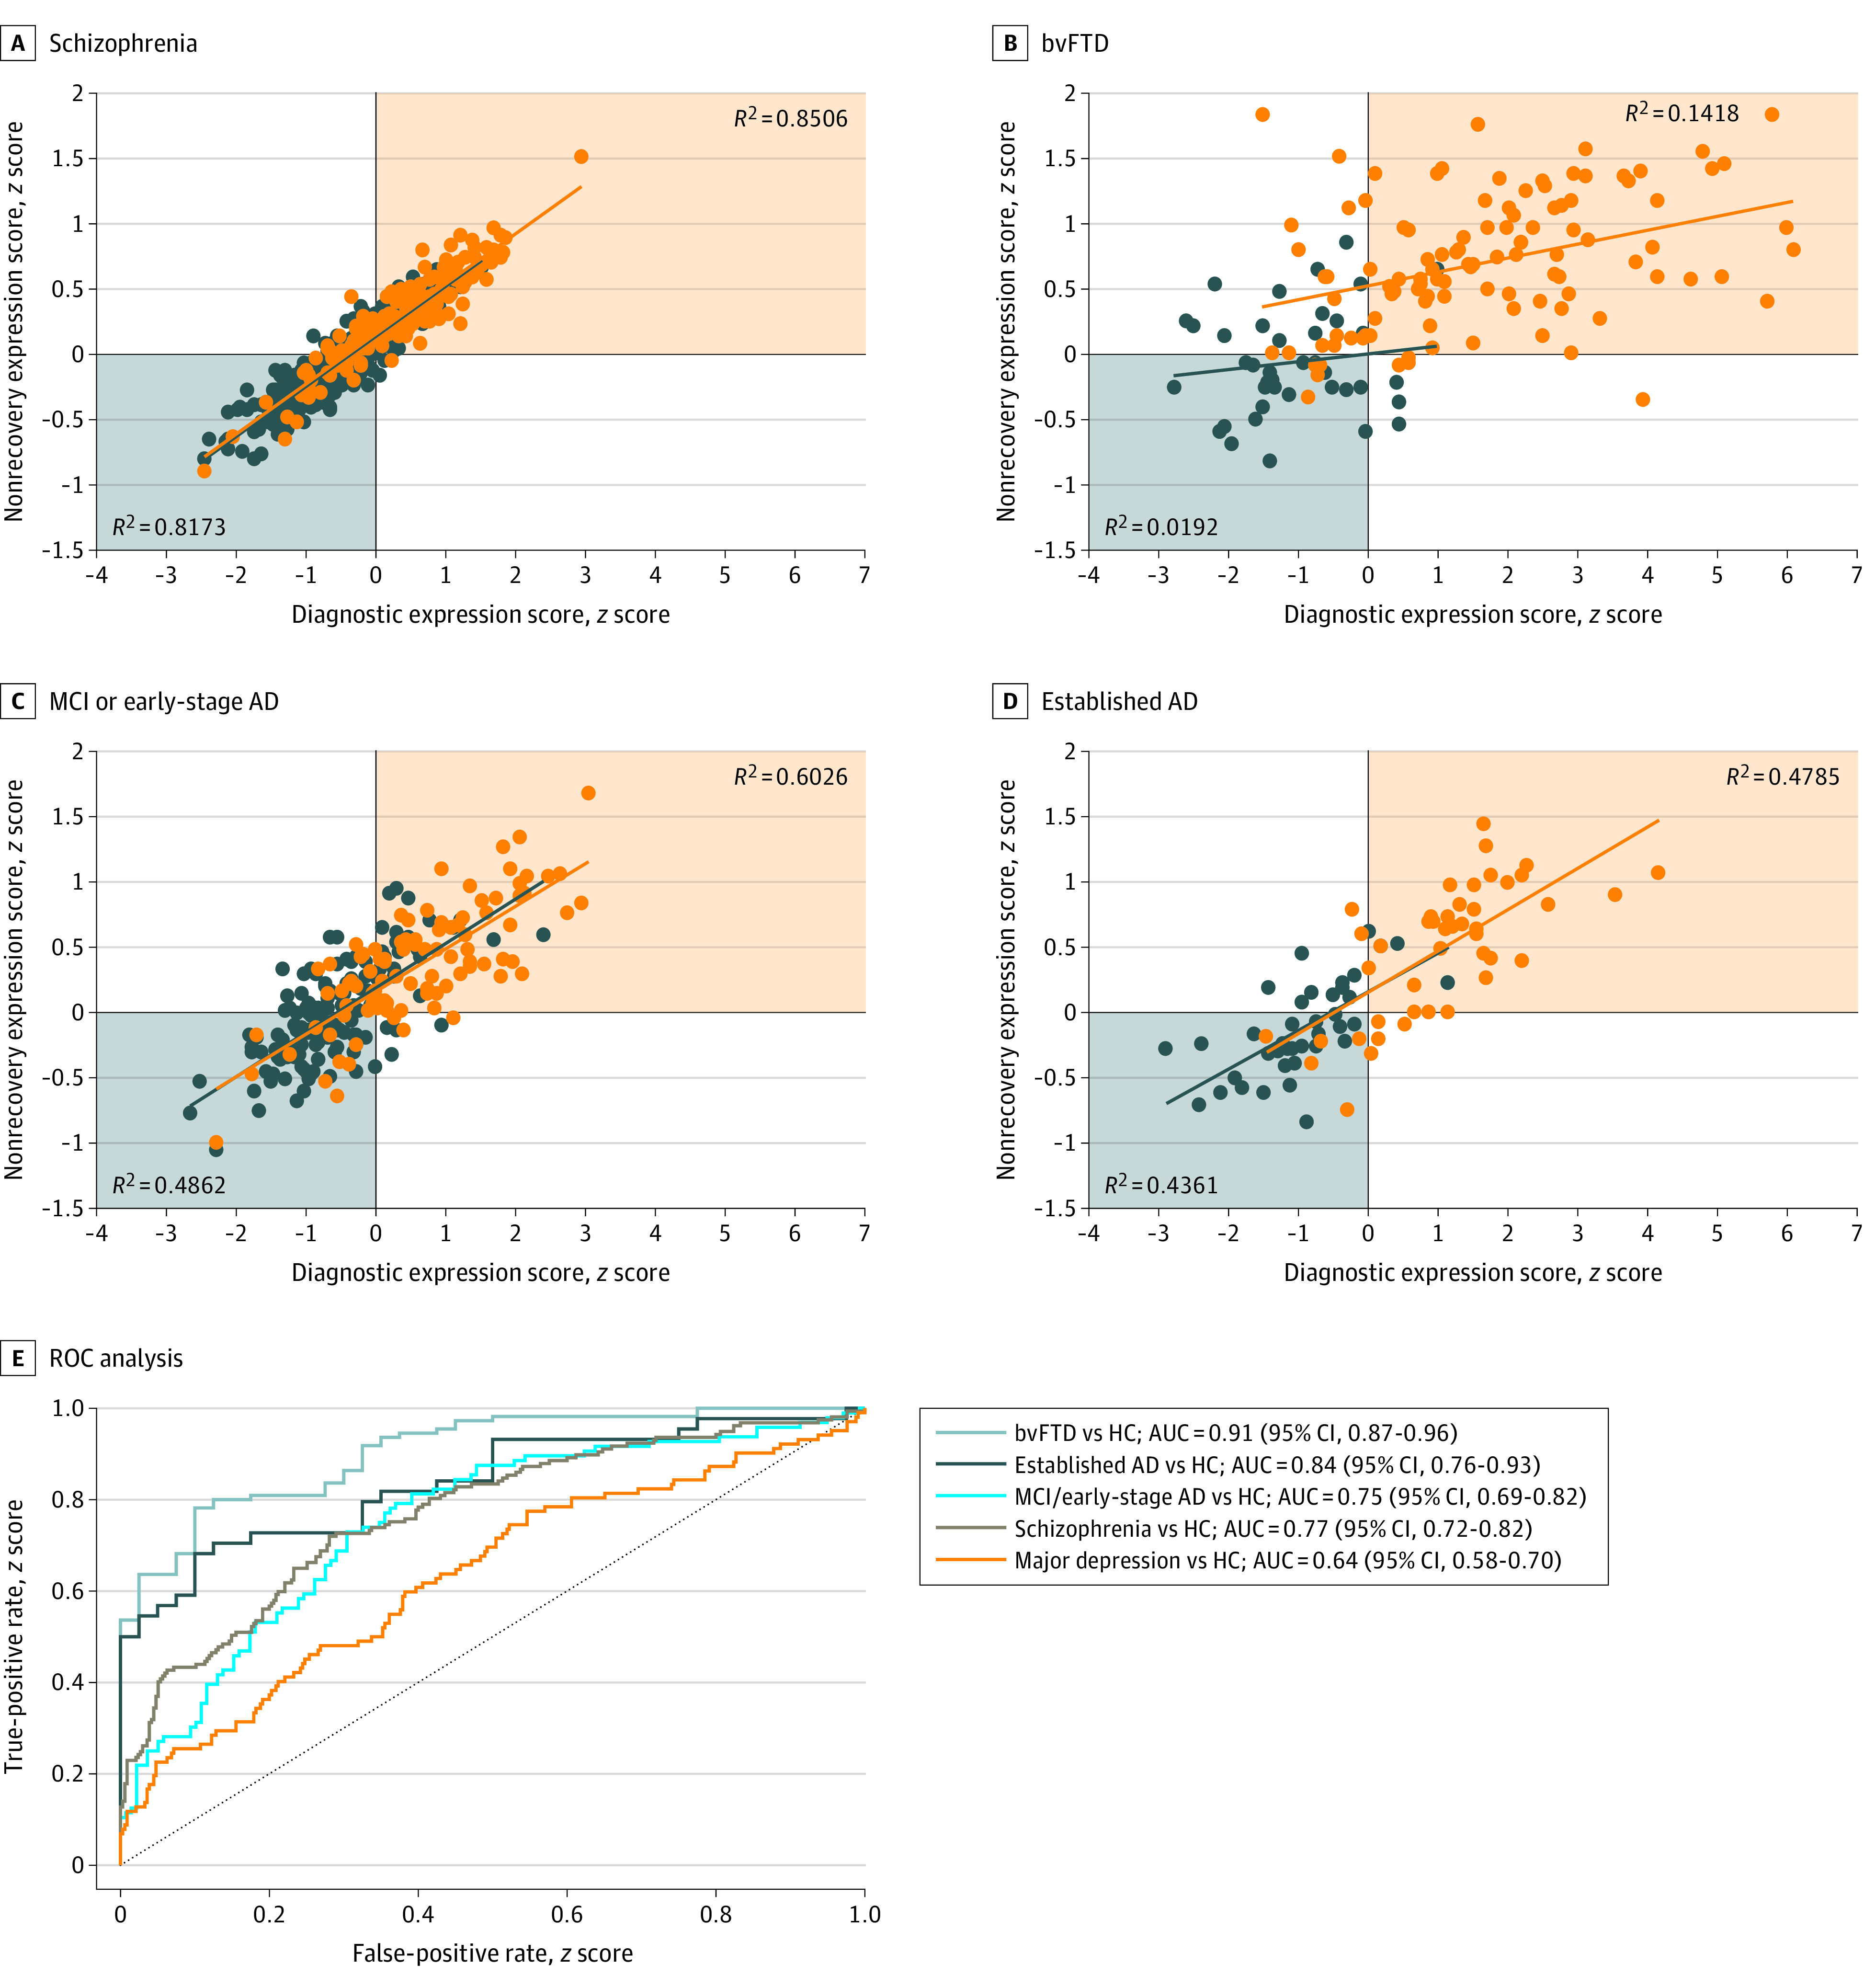
Figure 3. Associations of the Nonrecovery Prediction Model and the 4 Diagnostic Classifiers.

Orange indicates the patient group; blue, the healthy control group. Results were obtained after applying the nonrecovery classifier to patients with behavioral-variant frontotemporal dementia (bvFTD), established Alzheimer disease (AD), mild cognitive impairment (MCI) or early-stage AD, and schizophrenia and the respective healthy control (HC) samples. Scatterplots (A-D) describe the associations between the nonrecovery classifier and the respective diagnostic classifier’s diagnostic expression score in the given derivation cohort. E, The receiver operating characteristic curve analysis displays the separability of patients and HCs in the given diagnostic sample based on the prognostic score produced by the PRONIA nonrecovery classifier for the given sample. See eTable 10 in Supplement 1 for a tabular representation of the nonrecovery classifier prognostic performance and eFigures 24 to 26 in Supplement 1 for the visualization, topographical comparison, and spatial specificity test of the prognostic signature. AUC indicates area under the receiver operating characteristic curve.
