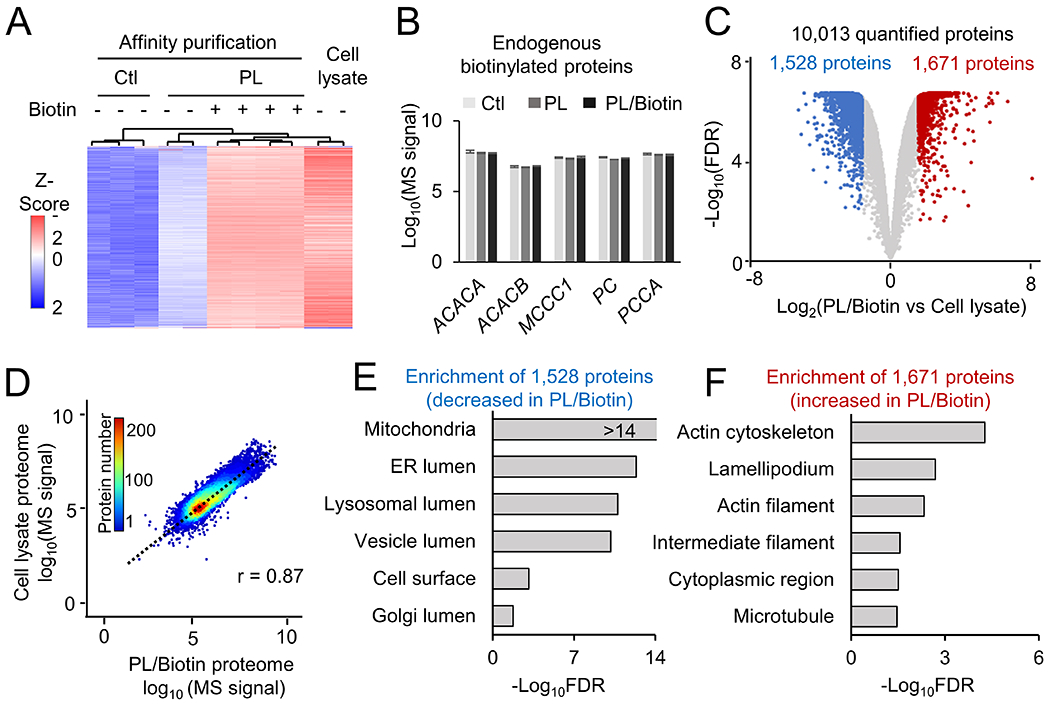
Figure 2.

Analysis of single cell type proteome in HEK293 cells by biotin labeling and TMT-MS. A, Heatmap of identified proteins under different conditions. B Quantification of endogenous biotinylated proteins under each condition. C, Volcano plot to show the comparison of total cell lysate proteome to the TurboID PL proteome with biotin addition. The cutoffs were FDR of 0.05, and fold change of 3 standard deviation (SD). Shown in colored dots are altered proteins. D, Correlation of TurboID PL/Biotin proteome with cell lysate proteome. The scatter plot shows the Log10 scale of each protein intensity. E-F, Pathway enrichment analysis of DE proteins in TurboID+biotin (PL/Biotin) compared to lysates based on GO database, with selected pathways shown.
