
Figure 4.
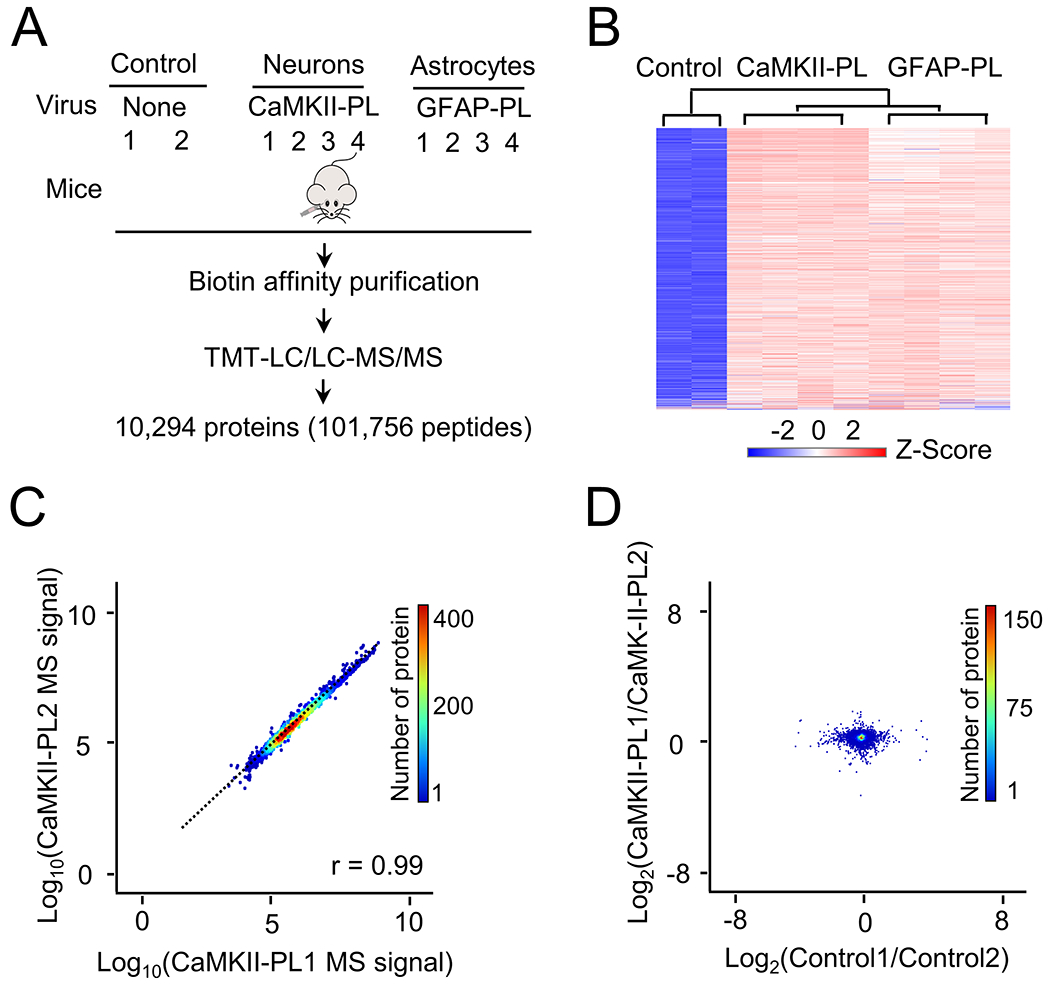
Analysis of single cell type proteome in the mouse brain by biotin labeling and TMT-MS. A, The analysis workflow with different cell types and negative controls. B, Heatmap of identified proteins by TMT-LC/LC-MS/MS, consistent with different conditions. C, A pair of biological replicate example to show the consistency of MS analysis (data from Supporting Table S6). D, Null (intragroup) comparison to show the small variation of individual proteins. Two control samples and two CaMKII PL samples are selected as examples.