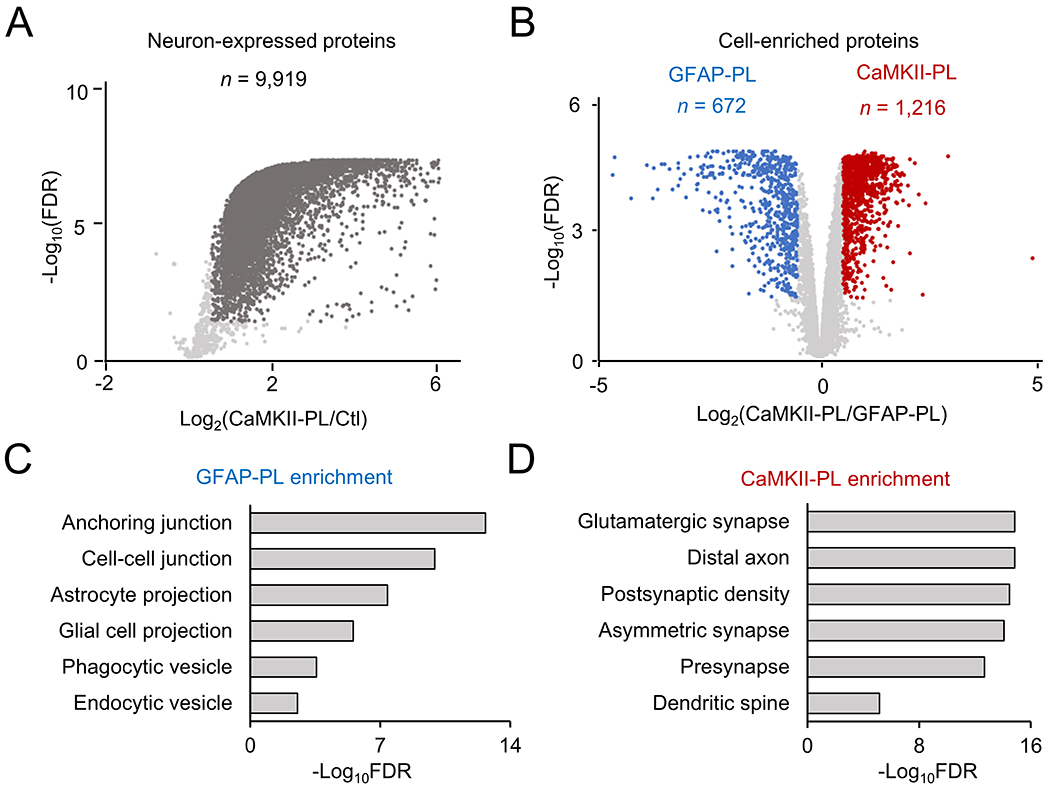
Figure 5.

Characterization of single cell type proteome in the mouse brain by statistical analysis. A, Volcano plot to show the comparison of negative control and CaMKII-PL proteome. The cutoffs were FDR of 0.05, and fold change of 3 standard deviation (SD). Highlighted dots: proteins enriched in the CaMKII-PL proteome. B, Similar volcano plot to show the comparison of GFAP-PL and CaMKII-PL proteomes. C-D, Pathway enrichment analysis of GFAP-PL- and CaMKII-PL-enriched proteins, with selected pathways shown.
