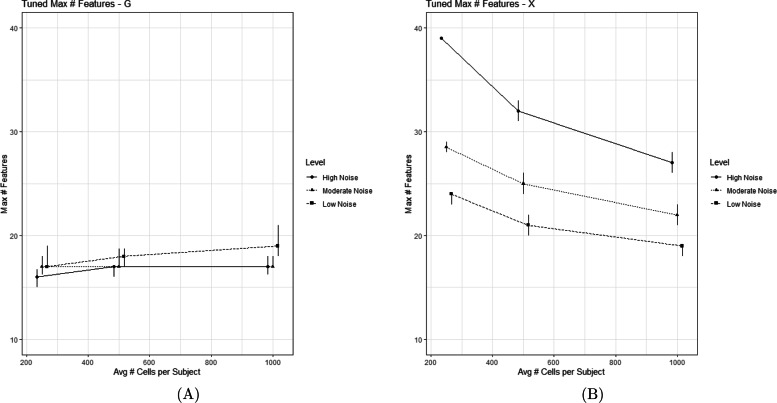
Fig. 3.
This figure displays the tuned maxG and maxX hyperparameters using the StARS method [22] across the 9 different simulation settings accounting for different numbers of average cells per subject and different levels of technical noise. The points represent the median tuned values and the bars represent the first and third quartiles across 50 iterations for each simulation setting. (A) displays the tuned max network size within , and (B) displays the tuned max network size within . Ideally, MOSCATO would tune maxG to 10 and maxX to 15 in order to select the proper network size according to Table 1

