Fig. 5.
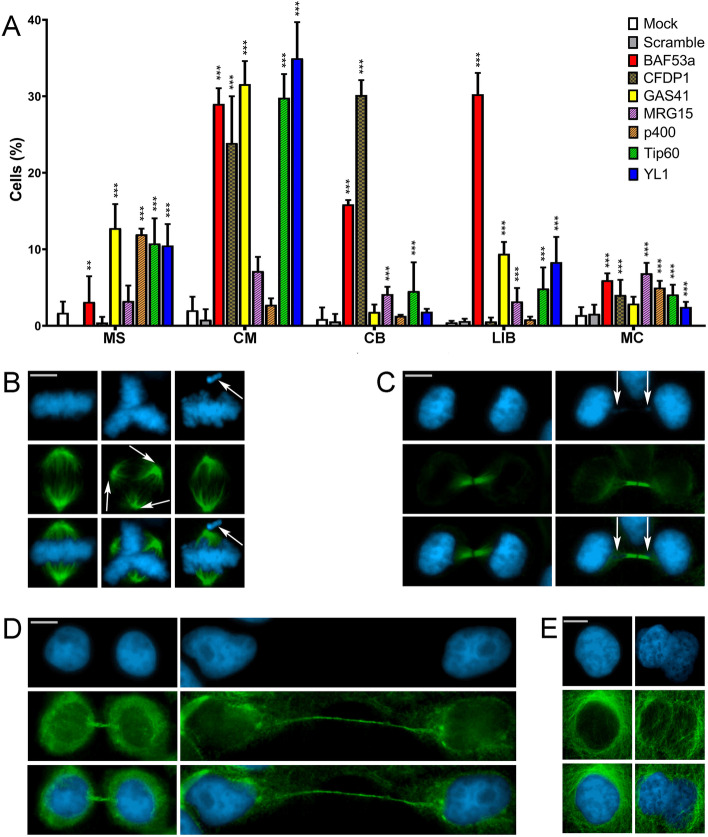
RNAi mediated depletion of CRS affects cell division in HeLa cells. Cells were stained with DAPI (blue) and anti-α-tubulin (green). Scale bar = 10 μm. Five classes of defects were categorized. A Histograms showing the quantitative analysis of cell division defects. Colors are referred to Fig. 1B. Bars with two different dashed lines indicate SCRAP complex-specific subunits (CFDP1) or p400/Tip60-specific subunits (MRG15, p400, and Tip60). Plain colored bars indicate subunits common to both complexes (BAF53a, GAS41, and YL1). B Mock, left panel; multipolar spindles (MS), middle panel; chromosome misalignments (CM), right panel. C Mock, left panel; chromatin bridges (CB) right panel. D Mock, left panel; long intercellular bridges (LIB) right panel; no DAPI-stained trapped chromatin was observed. E Mock, left panel; multinucleated cells (MC), right panel. Three independent experiments were performed. The quantitative analysis of defects scored in RNAi-treated and control cells (Table 2) is based on the following numbers: at least 100 prometaphases and metaphases for MS, 70 metaphases for CM and ASM, 300 telophases for LIB and CB, and 5500 interphases for MC. Experimental groups were compared with control groups (mocks and scrambles) by Fisher’s exact test.*=P < 0.05; **=P < 0.005; and ***=P < 0.0005

