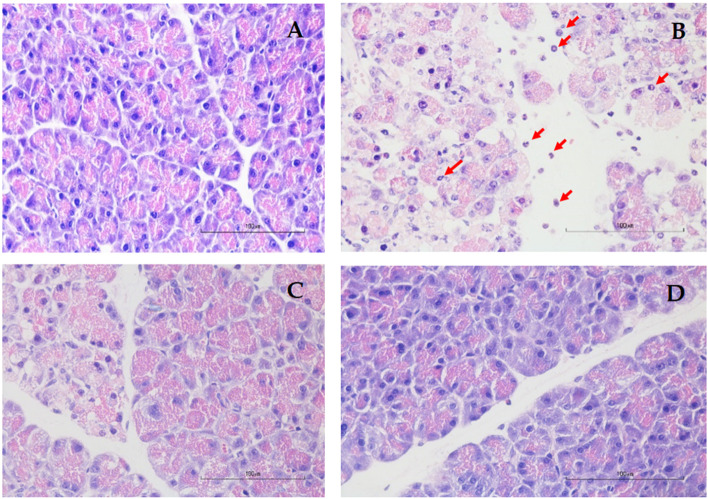
Fig. 2.
Pancreatic histopathology of hematoxylin–eosin staining at a magnification of 400, scale bar 100 µm. A Control group showed normal pancreatic architecture without any evidence of tissue damage; B Acute pancreatitis group showed severe tissue damage characterized by neutrophil infiltration (red arrow), edema, and acinar cell necrosis; C Low-dose genistein group showed reduced neutrophil infiltration, edema, and acinar cell necrosis; D High-dose genistein group showed reduced neutrophil infiltration, edema, and acinar cell necrosis

