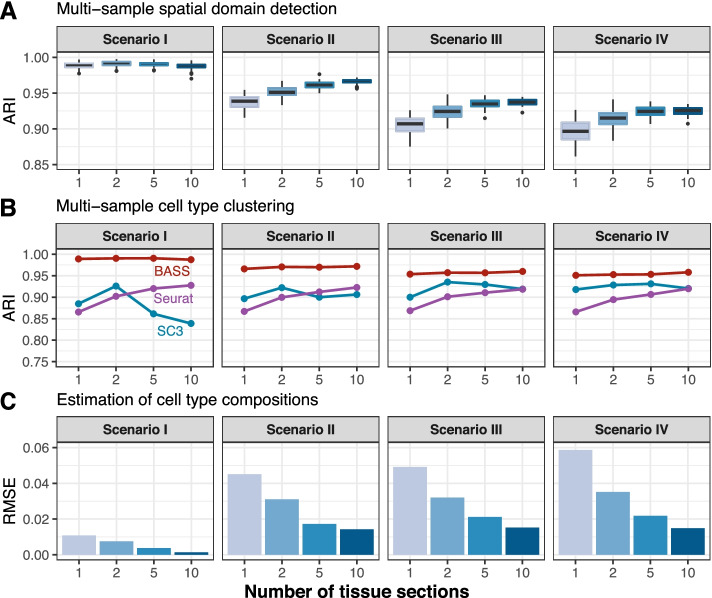
Fig. 3.
Comparison of different methods for spatial domain detection and cell type clustering in simulations with multiple tissue sections. A Boxplots of ARI show the accuracy of BASS for spatial domain detection (y-axis) in the presence of 1, 2, 5, or 10 tissue sections (x-axis). B Line plots display the median ARI by different methods for cell type clustering across 50 simulation replicates (y-axis) in the presence of 1, 2, 5, or 10 tissue sections (x-axis). Compared methods for cell type clustering include BASS, Seurat, and SC3. C Barplots show the median RMSE between the estimated cell type compositions and the true compositions across 50 simulation replicates (y-axis) in the presence of 1, 2, 5, or 10 tissue sections (x-axis). Simulations were conducted under Scenario I, Scenario II, Scenario III, and Scenario IV, with the simulation parameters set as the baseline setting: the number of genes (nGenes) = 200, the proportion of genes that were differentially expressed in each cell type versus the others (de. prob) = 0.2, and the DE strength (de. facloc) = 1.1

