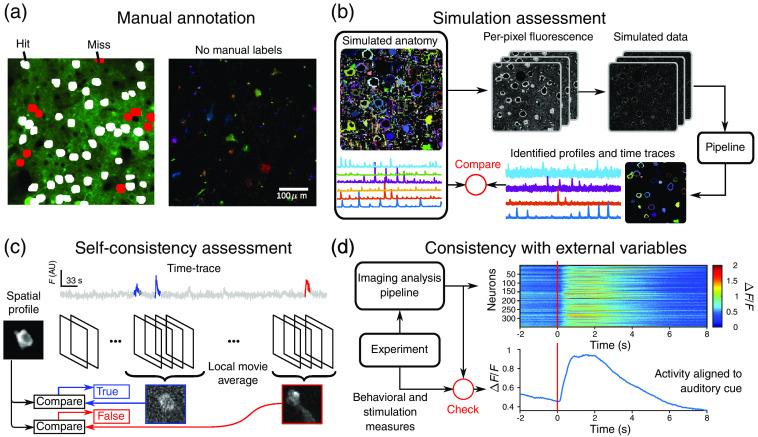
Fig. 5.
Assessing optical imaging analysis outputs. (a) Manual annotation, e.g., the NeuroFinder benchmark dataset (example shown here), can help detect true detections (white) and missed cells (red), as compared with a labeling of the spatial area imaged (right). Manual annotation, however, does not provide information on cells that do not match any of the manual annotations (left). (b) Simulation-based assessment uses in silico simulations of activity and anatomy to create faux fluorescence microscopy data. The outputs of an analysis pipeline using the data can be compared with the simulated ground truth. (c) Self-consistency measures use the global demixed components and analyze local space-time extents of the movie to check if the spatial and temporal components still describe the data well. For example, is activity erroneously attributed to a found cell. (d) Consistency with external variables examines if expected gross behavior of the imaged neural populations match behavioral or stimulation events corecorded with the fluorescence video. For example, shown here are neurons in motor cortex responding to a motion made by a mouse responding to an auditory cue.200

