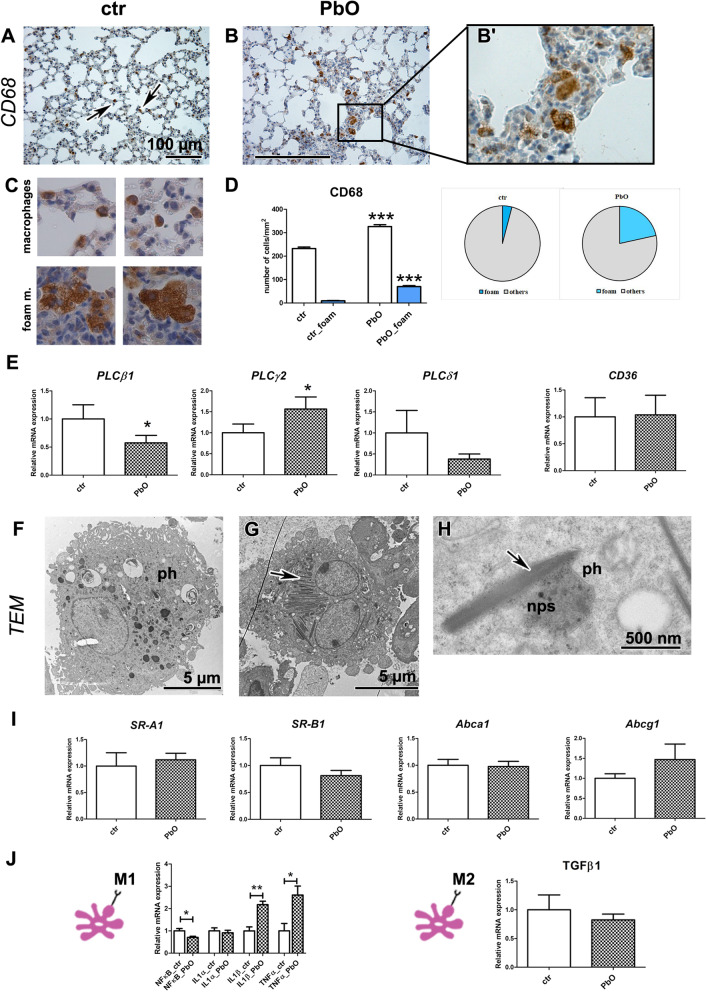
Fig. 5.
Lung macrophages after 11-week PbO NP inhalation. A, B, B′ Detection of CD68-positive cells (marker of macrophages) in lungs (arrows). Scale bar in panels = 100 µm. C CD68-positive cells labelled as typical macrophages (two upper images) or foam macrophages (two lower images) at the same magnification in the slides. Differences in size and cytoplasm morphology of typical or foam macrophages are well distinguishable. D The number of macrophages, including foam macrophages, was significantly increased compared with the control group (the graphs values indicate average ± SD; ***p < 0.001 by unpaired t-test. E Gene expression of phospholipases C, and receptor CD36 after PbO NP inhalation. The graphs values indicate average ± SD; *p < 0.05 compared with the corresponding control group (ctr) by unpaired t-test. F, G TEM images of foam alveolar macrophages with phagosomes (ph) in PbO NP group of animals. Arrow indicates cholesterol crystals in cytoplasm of macrophage. H Close interaction between phagosome (ph) with nanoparticles (nps) and cholesterol crystal (arrow). Scale bars are displayed individually for each picture. I Gene expression of receptors SR-A1, SR-B1, Abca1 and Abcg1 after PbO NP inhalation. The graphs values indicate average ± SD. J Gene expression of selected markers specific for M1 or M2 macrophage populations. The graphs values indicate average ± SD; *p < 0.05; **p < 0.01 compared with the corresponding control group (ctr) by unpaired t-test

