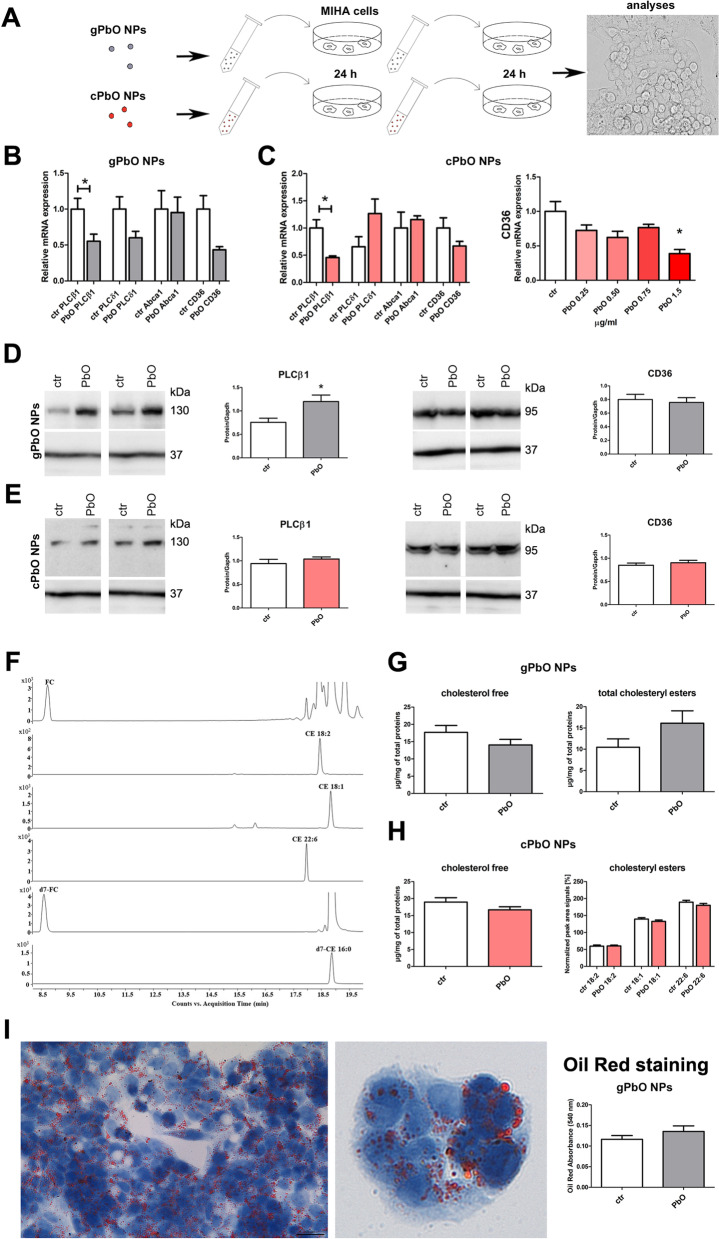
Fig. 8.
Effect of PbO NPs on liver cells. A Design of in-vitro experiments. Symbols of gray circle indicate in-situ generated PbO NPs (gPbO NPs), and symbols of red circles indicate commercially available PbO NPs (cPbO NPs). B Gene expression of selected phospholipases C, receptors CD36 and Abca1 in cells after gPbO NP treatment. The graphs values indicate average ± SD; *p < 0.05 compared with the corresponding control group (ctr) by unpaired t-test. C Gene expression of selected phospholipases C, receptors CD36 and Abca1 in cells after cPbO NP treatment. The graphs values indicate average ± SD; *p < 0.05 compared with the corresponding control group (ctr) by unpaired t-test. D Protein expression of phospholipase PLCβ1 and receptor CD36 after gPbO NP treatment. The quantitative comparison of protein levels was normalized to GAPDH levels. The band densities are representative of three independent experiments. The graphs values denote average ± SD; *p < 0.05 by unpaired t-test. E Protein expression of phospholipase PLCβ1 and receptor CD36 after cPbO NP treatment. The quantitative comparison of protein levels was normalized to GAPDH levels. The band densities are representative of three independent experiments. The graphs values denote average ± SD. F Representative graphs extracted ion chromatograms (EIC-MRM) of LC-ESI MS/MS separation of selected lipids and internal deuterated standards. Free cholesterol and three most abundant species of CEs were isolated from liver MIHA cells. G, H Quantification of free cholesterol and total and selected individual CEs analyzed in MIHA cells after gPbO NP or cPbO NP treatment measured by LC–MS and Cholesterol/Cholesteryl Ester Quantitation Kit. LC–MS provided information about changes of free cholesterol and three most abundant species of CEs. The total CEs and free cholesterol concentrations were obtained using the commercial kit. The abundance of free cholesterol is given in µg. The relative quantitative responses of individual CEs are given as normalized peak area signals (expressed as a percentage). All obtained values were normalized to the signals of deuterated internal standards and 1 mg of total proteins in the sample. The statistical significance was evaluated by unpaired t-test. I Oil Red staining of lipids in MIHA cells and measuring of their absorbance to quantify oil content after gPbO NP treatment

