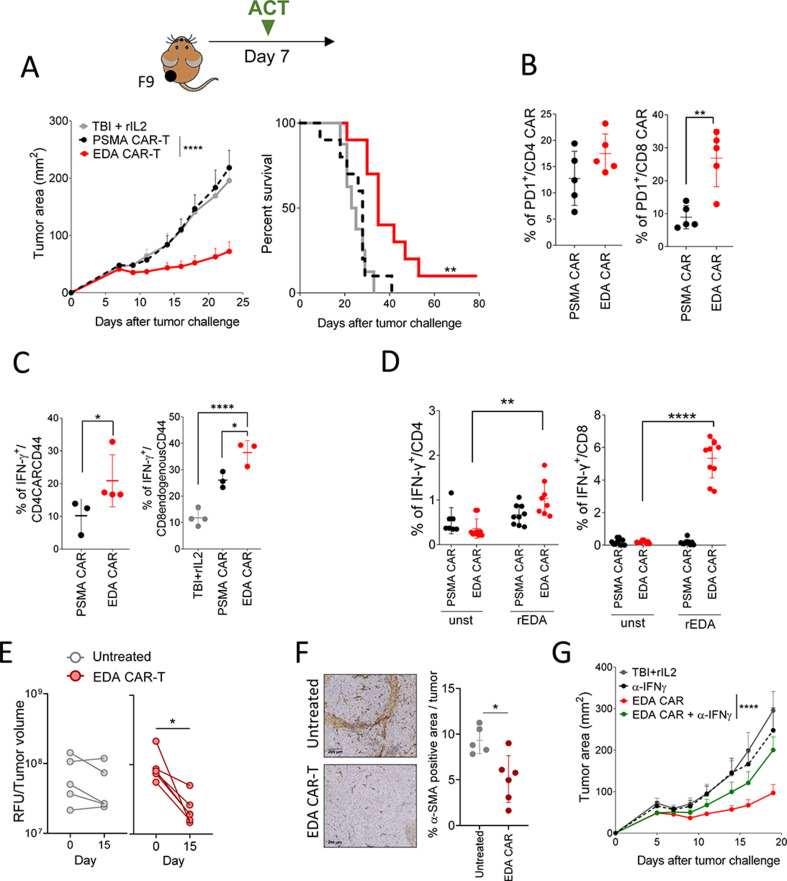
Figure 5.
EDA CAR-T cells delay F9 teratocarcinoma tumor growth. (A) 129SV mice-bearing F9 tumor cells (n=10 mice per group) were treated with a single dose of 1×10⁷ of EDA CAR-T or PSMA CAR-T cells. tumor growth at different time points (left) and Kaplan-Meier plot of survival of mice-bearing tumors (right) are plotted. (B) Characterization of PD1+ CAR-T cells infiltrating the tumor 7 days after cell transfer (n=5). (C) Percentage of IFN-γ producing CD4 CAR-T or CD8 endogenouse cells in the draining lymph nodes after a short stimulation with PMA/ionomycin. (D) Percentage of IFN-γ in CD4 and CD8 after short stimulation with recombinant EDA protein coated plate. (E) Direct in vivo estimation of tumor vasculature using Angiosense 750 at days −1 and 14 after EDA CAR-T-cell infusion, expressed as relative fluorescence units divided by tumor volume in 129SV mice-bearing F9 subcutaneous tumors. untreated mice were used as negative control (n=5–6 mice/group). (F) α-SMA immunohistochemistry analysis on tumor samples at day 14 after EDA CAR-T therapy. Two representative images for untreated and EDA CAR-T treated mice and the quantification of α-SMA positive area are shown. Data are representative of two independent experiments. (G) Effect of IFN-γ neutralization on the antitumor effect of EDA CAR-T cell infusion. *P<0,05, **p<0.01, ****p<0.0001. (A) Survival curve was analyzed by the log-rank test. Student’s t-test (B, C, F) One-way ANOVA with Bonferroni multiple comparisons test (C, D). Paired t-test (E). Nonlinear regression analysis (G). The mean and SD for each group are plotted. Each symbol represents an individual mouse. CAR-T, chimeric antigen receptor T-cell; EDA, extra domain A.

