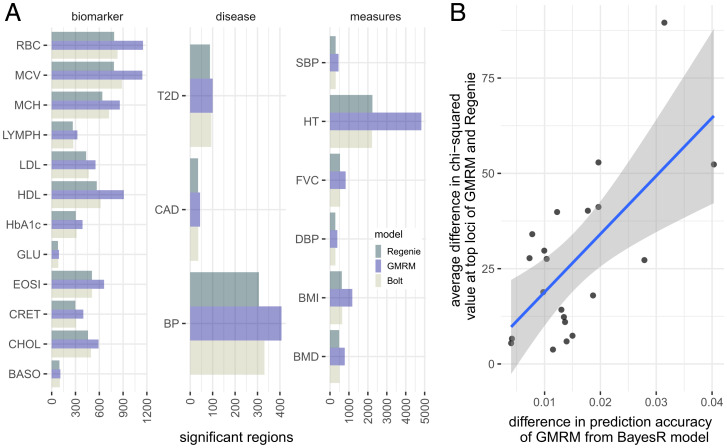
Fig. 3.
GWAS discovery of a GMRM in the UK Biobank. (A) Number of LD-independent genomic regions identified at by GMRM, compared to in BoltLMM (Bolt) and Regenie (Regenie) across 21 traits. (B) For SNP markers identified at by Bolt, Regenie, and GMRM, we estimated the difference in value between GMRM and Regenie and plotted this against the difference in prediction accuracy of GMRM compared to a BayesR model, to test whether discovery power scales with improved prediction accuracy of using MAF-LD annotation groups. Shaded area gives the 95% CIs of the regression line. Full trait code descriptions are given in SI Appendix, Table S1.

