Fig. 1.
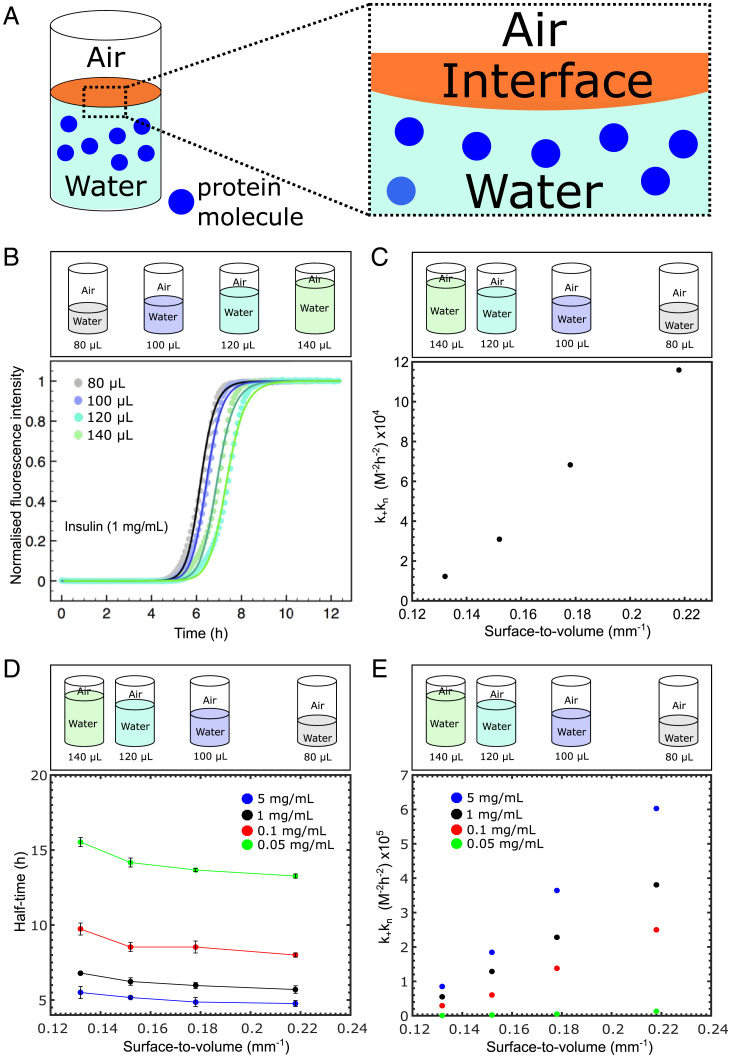
(A) Schematic representation of the interface involved in our experimental approach. (B and C) (Top) Schematic representation of the experimental approach used. Different surface-to-volume ratios were used to investigate the surface dependence on protein self-assembly. (B) Graph of normalized ThT fluorescence intensity as a function of time for a 1 mg/mL solution of insulin for four different volumes. The corresponding kinetic data were then fitted using AmyloFit (35) and are shown as the solid lines. (C) Graph of kkn as a function of the surface-to-volume ratio. (D) Graph of half-time as a function of the surface-to-volume ratio for four different insulin concentrations. (E) Graph of kkn as a function of the surface-to-volume ratio for the four different insulin concentrations in D.

