Fig. 4.
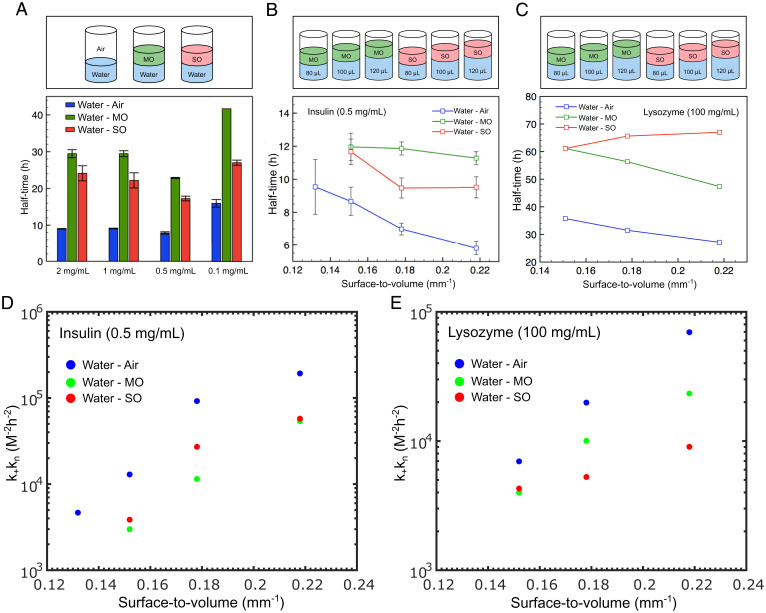
(A–C) (Top) Schematic showing the investigation into protein aggregation kinetics using different interfaces: air, MO, and SO. (A) Plot of the aggregation half-time for four different insulin concentrations for three interface systems: water–air, water–MO, and water–SO. (B) Graph of half-time as a function of the surface-to-volume ratio for the three different interface systems at a fixed insulin concentration of 0.5 mg/mL. (C) Graph of half-time as a function of the surface-to-volume ratio for the three different interface systems at a fixed lysozyme concentration of 100 mg/mL. (D) Graph of kkn as a function of the surface-to-volume ratio for the three different interface systems at a fixed insulin concentration of 0.5 mg/mL. (E) Graph of kkn as a function of the surface-to-volume ratio for the three different interface systems at a fixed lysozyme concentration of 100 mg/mL.

