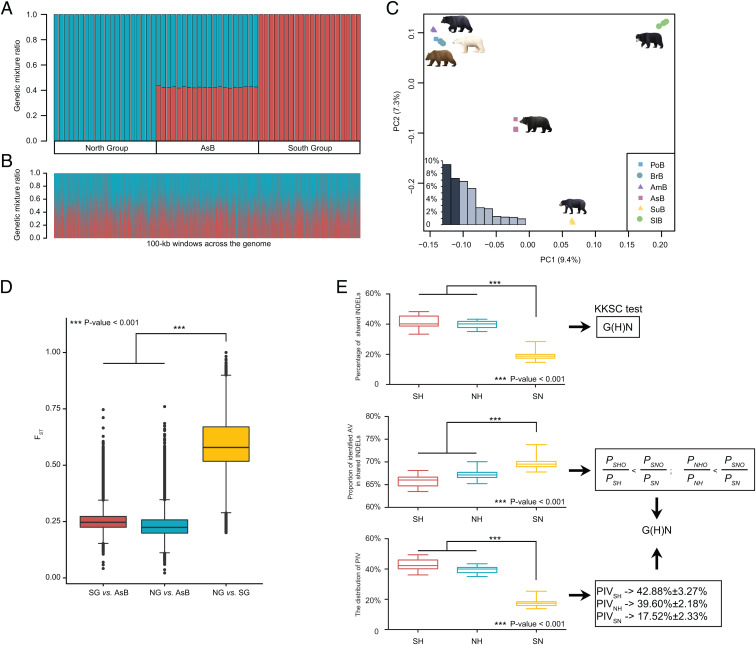
Fig. 2.
The hybrid origin of the Asiatic black bear based on HyDe, PCA, FST, and shared variations analyses. (A) HyDe analysis. AsB represents Asiatic black bear. The y axis indicates the proportion of genetic mixture for each individual; blue represents genetic contribution (γ) from the North Group and red represents genetic contribution (1 − γ) from the South Group. (B) HyDe scans with 100-kb sliding windows across the genome of the Asiatic black bear. (C) PCA results for 60 bears representing six Ursinae species. The inset bar plot shows the values of the 10 primary components, of which PC1 and PC2 explained the greatest proportions of the variance. (D) Distributions and comparisons of genomic 100-kb windowed FST for the three population pairs (SG vs. AsB, NG vs. AsB, and NG vs. SG). (E) Detection of hybrid speciation based on shared INDELs (S: South Group; H: Hybrid species Asiatic black bear; N: North Group; O: Outgroup spectacled bear). (Top) Percentages of shared INDELs in SH (South Group and Hybrid species Asiatic black bear: red bars), NH (North Group and Hybrid species Asiatic black bear: blue bars), and SN (South Group and North Group: yellow bars). A KKSC test supports the hybrid speciation model G(H)N. (Middle) Proportion of AVs. The values of SH, NH, and SN were calculated based on the numbers of shared INDELs in SHO/SH, NHO/NH, and SNO/SN, respectively. A Student’s t test of these data supported . (Bottom) Percentages of shared phylogenetically informative variations in SH, NH, and SN.

