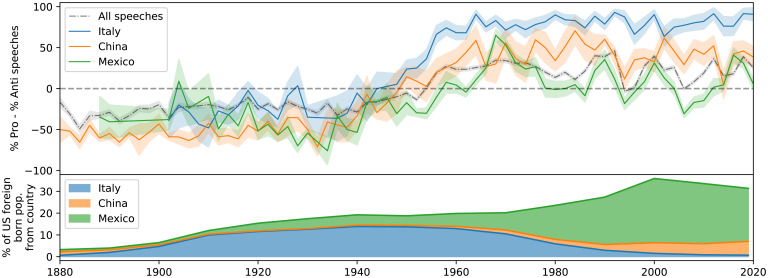
Fig. 2.
Average tone of immigration speeches when considering only those speeches that mention the country or nationality for each of the three most frequently mentioned nationalities (Top) and the percent of the US foreign-born population from each of these countries over time (Bottom). Despite the midcentury increase in proimmigration attitudes applying to all groups, a gap in tone by group persists to the present day, with Mexican immigrants being consistently framed more negatively than others and Italian immigrants being framed especially positively. These trends are mirrored in broader regional patterns for Europe, Asia, and Latin American and the Caribbean (SI Appendix).

