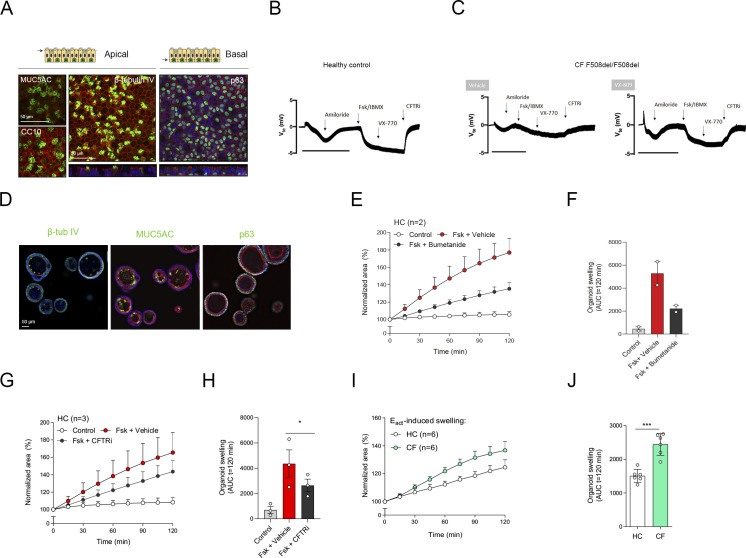
Figure S2. Characterization of air–liquid interface (ALI)-human nasal epithelial cell (HNEC) and nasal-airway organoid (NAO) swelling assay.
(A) Whole-mount IF confocal images of ALI-HNEC, showing maximal projections of the apical side of the secretory cell markers MUC5AC and club cell protein 10 (CC10), and ciliated cell marker β-tubulin IV (Z-stack at the bottom). The projection of the basal side shows the basal-cell marker p63 (Z-stack at the bottom). All markers are shown in green. (B, C) Open circuit Ussing chamber tracings showing transepithelial voltage measurements (Vte) from healthy control (B) and cystic fibrosis (CF) F508del/F508del (C) ALI-HNEC cultures. CF cultures were pre-treated with VX-809 or vehicle. During measurements, cells were treated sequentially with amiloride, Fsk/IBMX, VX-770, and CFTRi. The bar corresponds to a 10-min frame. (D) IF staining of NAOs for β-tubulin IV, MUC5AC, and p63 (all in green). (E, F) HC NAOs (n = 2 independent donors) were pre-treated with bumetanide or vehicle for 4 h, followed by stimulation with forskolin (Fsk) and assessment of forskolin-induced swelling (FIS). (G, H) HC NAOs (n = 3 independent donors) were pre-treated with CFTR inhibitors or vehicle, followed by assessment of FIS. (I, J) Comparison between HC and CF organoid swelling (both n = 6 independent donors) after stimulation with the calcium-activated chloride channel agonist Eact. (A, B) Data information: DAPI (blue) was used as nuclear staining; phalloidin (red) was used as actin cytoskeleton staining (A, D). (E, F, G, H, I, J) FIS assay results are depicted as the percentage change in surface area relative to t = 0 (normalized area) measured at 15-min time intervals for 2 h (means ± SD) (E, G, I) and as area-under-the-curve (AUC) plots (t = 120 min, means ± SD) (F, H, J). (H, J) Analysis of differences was determined with a paired (H) or unpaired (J) t test. *P < 0.05, ***P < 0.001.

