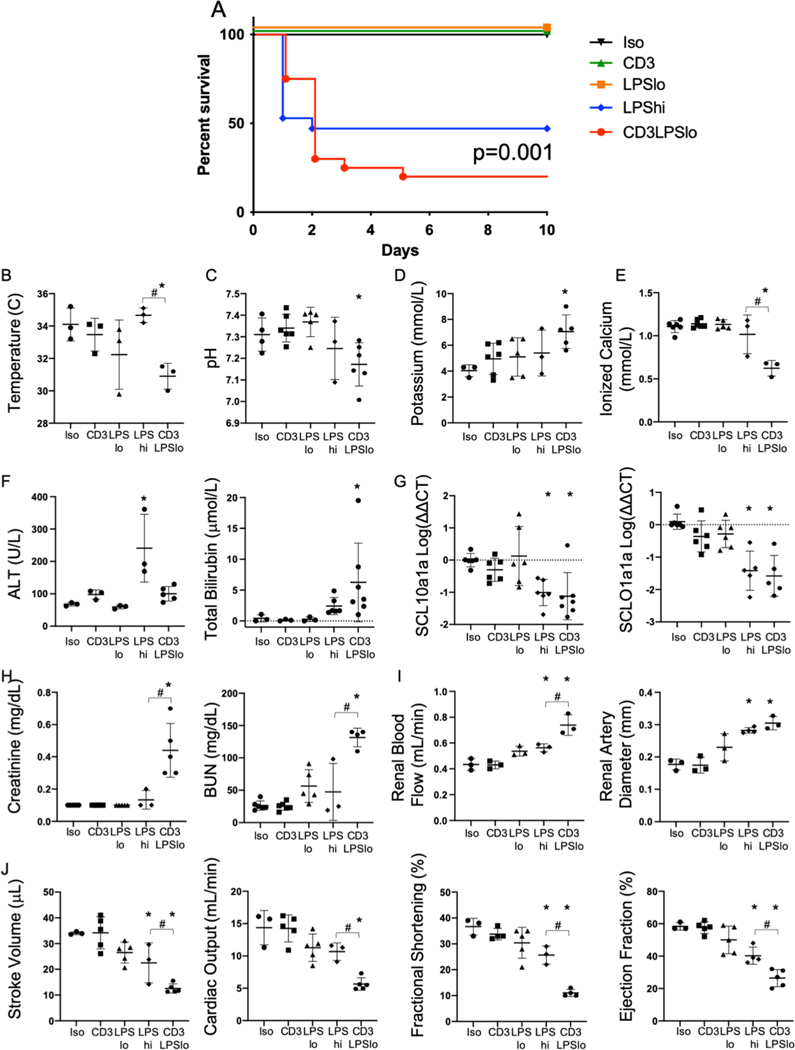
Figure 1. Effects of T cell Receptor Activation on LPS-induced Survival and Organ Injury.
Five treatment groups of C57Bl/6 mice were studied: Iso - control isotype antibody treatment (50μg), CD3 - anti-CD3ε T cell activating antibody treatment (clone 145–2C11, 50μg), LPSLo - low dose LPS (60μg) + isotype antibody treatment, LPSHi - high dose LPS (600μg) + isotype antibody treatment, CD3LPSLo - CD3 + LPSLo treatment. Animals were either observed until demise (or for up to ten days) or were studied at 24 hrs. following treatment. Data as mean ± standard deviation. * = p<0.05 compared to Iso # = p<0.05 LPSHi vs. CD3LPSLo. Spearman’s Log-rank test for Fig1A; all other data examined using one-way ANOVA with Dunnett correction for multiple comparisons. Figures representative of at least two independent experiments.
A. Ten-day Survival following challenge. N=5–11/group.
B. Rectal temperature (°C). N=3/group.
C. Serum pH. N=4–6/group.
D. Serum potassium level (mmol/L) N=4–6/group.
E. Serum ionized calcium level (mmol/L). N=4–6/group.
F. Serum levels of alanine aminotransferase (U/L) and total bilirubin (μmol/L). N=3–7/group.
G. Relative hepatic abundance of mRNA encoding Sodium/Bile Acid Cotransporter (SCL10a1a, Left) and Organic Anion Transporter (SCLO1a1, Right). ΔΔCT values of each sample normalized to GAPDH to account for loading, mean value for abundance of control specimen arbitrarily set at unity. Shown as Log10. N=3–4/group.
H. Left: Serum Creatinine (mg/dL). Right: Blood urea nitrogen (BUN, mg/dL). N=4–6/group.
I. Left: Renal blood flow (mL/min). Right: Renal artery diameter (mm). N=4–6/group.
J. Echocardiographic Parameters. Left – Stroke Volume (μL), Left Middle - Cardiac Output (mL/min), Right Middle - Fractional Shortening (%), Right – Ejection Fraction (%)). N=3/group.

