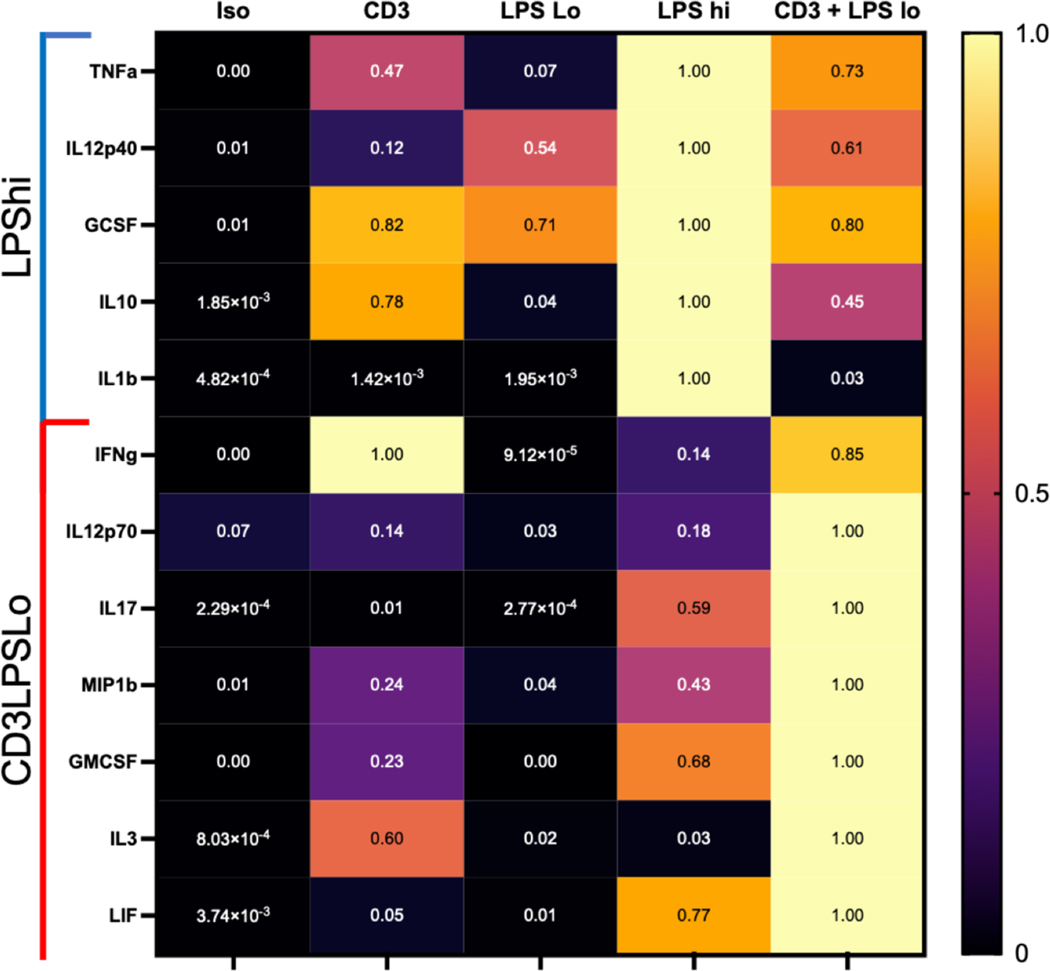
Figure 2. Effects of T cell Receptor Activation on the Serum Cytokine Response to LPS.
Abbreviations for the five treatment groups of C57Bl/6 mice as detailed in Fig. 1. Data obtained 24 hrs. following treatment. Serum cytokines determined using multiplex ELISA, confirmed using individual ELISAs. Data shown as percent cytokine levels above or below serum levels in Iso cohort. Significance (p<0.05 ) relative to Iso determined using one-way ANOVA with Dunnett correction for multiple comparisons on absolute values. LPSHi - cytokines that were significantly different than Iso cohort in response to 600μg of LPS. CD3LPSLo - cytokines that were significantly different than Iso cohort in response to anti-CD3ε T cell activating antibody (50μg) + 60μg LPS.

