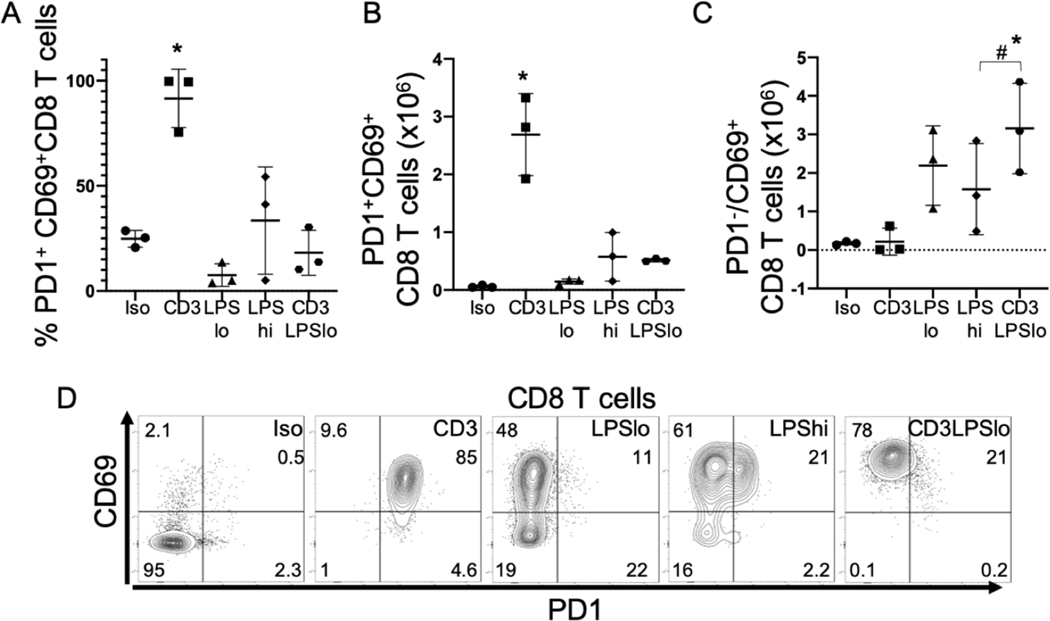
Figure 5. Effects of LPS on Splenic T cell Checkpoint Induction in Response to T cell Receptor Activation.
Abbreviations for the five treatment groups of C57Bl/6 mice as detailed in Fig. 1. Animals were studied at 24 hrs. following treatment. Gating: FSC/SSC, singlets, Live, CD90/CD4, CD90/CD8, CD69/PD1. Full gating strategy shown in Supp. Fig. 5(A). Data as mean ± standard deviation.
* = Significance determined using one-way ANOVA with Dunnett correction for multiple comparisons. p<0.05 relative to Iso # = p<0.05 LPSHi vs. CD3LPSLo. Figures representative of at least two independent experiments.
A. Percent of splenic CD69+ CD8 T cells expressing PD1. N=3/group.
B. Number of PD1+CD69+ CD8 T cells obtained from the spleen. N=3/group.
C. Number of PD1−CD69+ CD8 T cells obtained from the spleen. N=3/group
D. Flow cytometric plots following treatment showing CD69/PD1 in CD8 T cells. Numbers represent average percentage of 3–4 replicates.

