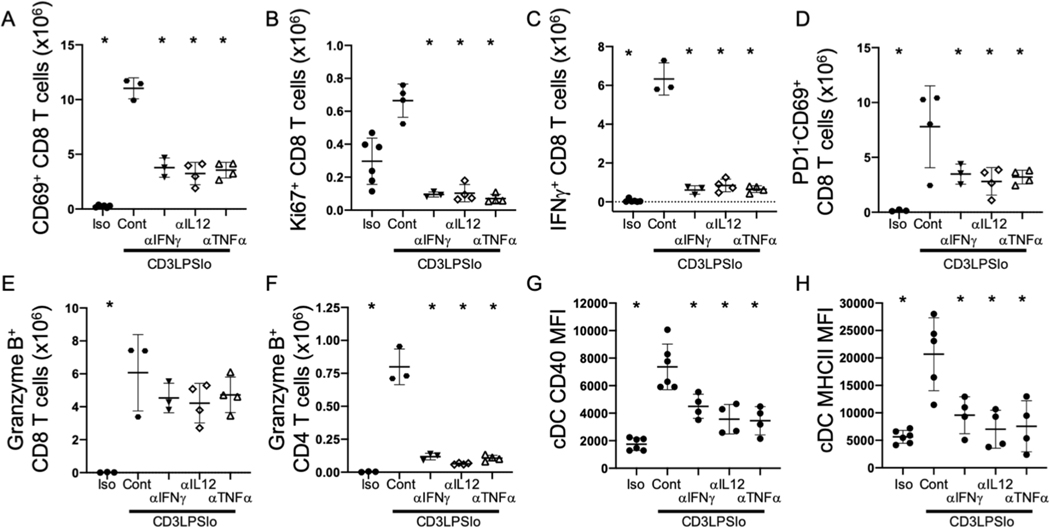
Figure 7. Effects of Cytokine Blockade on the T cell and Innate Immune Response to TCR modulated LPS Challenge.
Iso, CD3LPSLo, or LPSHi mice treated with blocking antibodies to IFNγ, TNFα or IL12p40 as per previous figure on day 1 of challenge and every 3 days following. Mice studied 24 hrs. following treatment. Gating: T cells: FSC/SSC, singlets, Live, CD90/CD4, CD90/CD8, CD69, Ki67, Granzyme B, PD1. Classical Dendritic Cells: FSC/SSC, singlets, Live, CD11c+/CD11b+/−, CD11c+/MHCII+, MHCII, CD40. Data as mean ± standard deviation, full gating strategy shown in Supp. Fig. 5B and 6. Significance determined using one-way ANOVA with Dunnett correction for multiple comparisons; * = p<0.05 relative to CD3LPSLo. Figures representative of at least two independent experiments.
A. Number of CD69+ CD8 T cells obtained from the spleen. N=3–4/group.
B. Number of Ki67+ CD8 T cells obtained from the spleen. N=3–4/group.
C. Total splenic CD8 T cells producing IFNγ ex vivo without stimulation. Cells treated with Brefeldin A for four hours prior to intracellular cytokine staining. N=3–4/group.
D. Number of PD1−CD69+ CD8 T cells obtained from the spleen. N=3–4/group.
E. Number of Granzyme B+ CD8 T cells obtained from the spleen. N=3–4/group.
F. Number of Granzyme B+ CD4 T cells obtained from the spleen. N=3–4/group.
G. CD40 MFI for cDCs. N=6/group.
H. MHCII MFI for cDCs and MoDCs. N=6/group.

