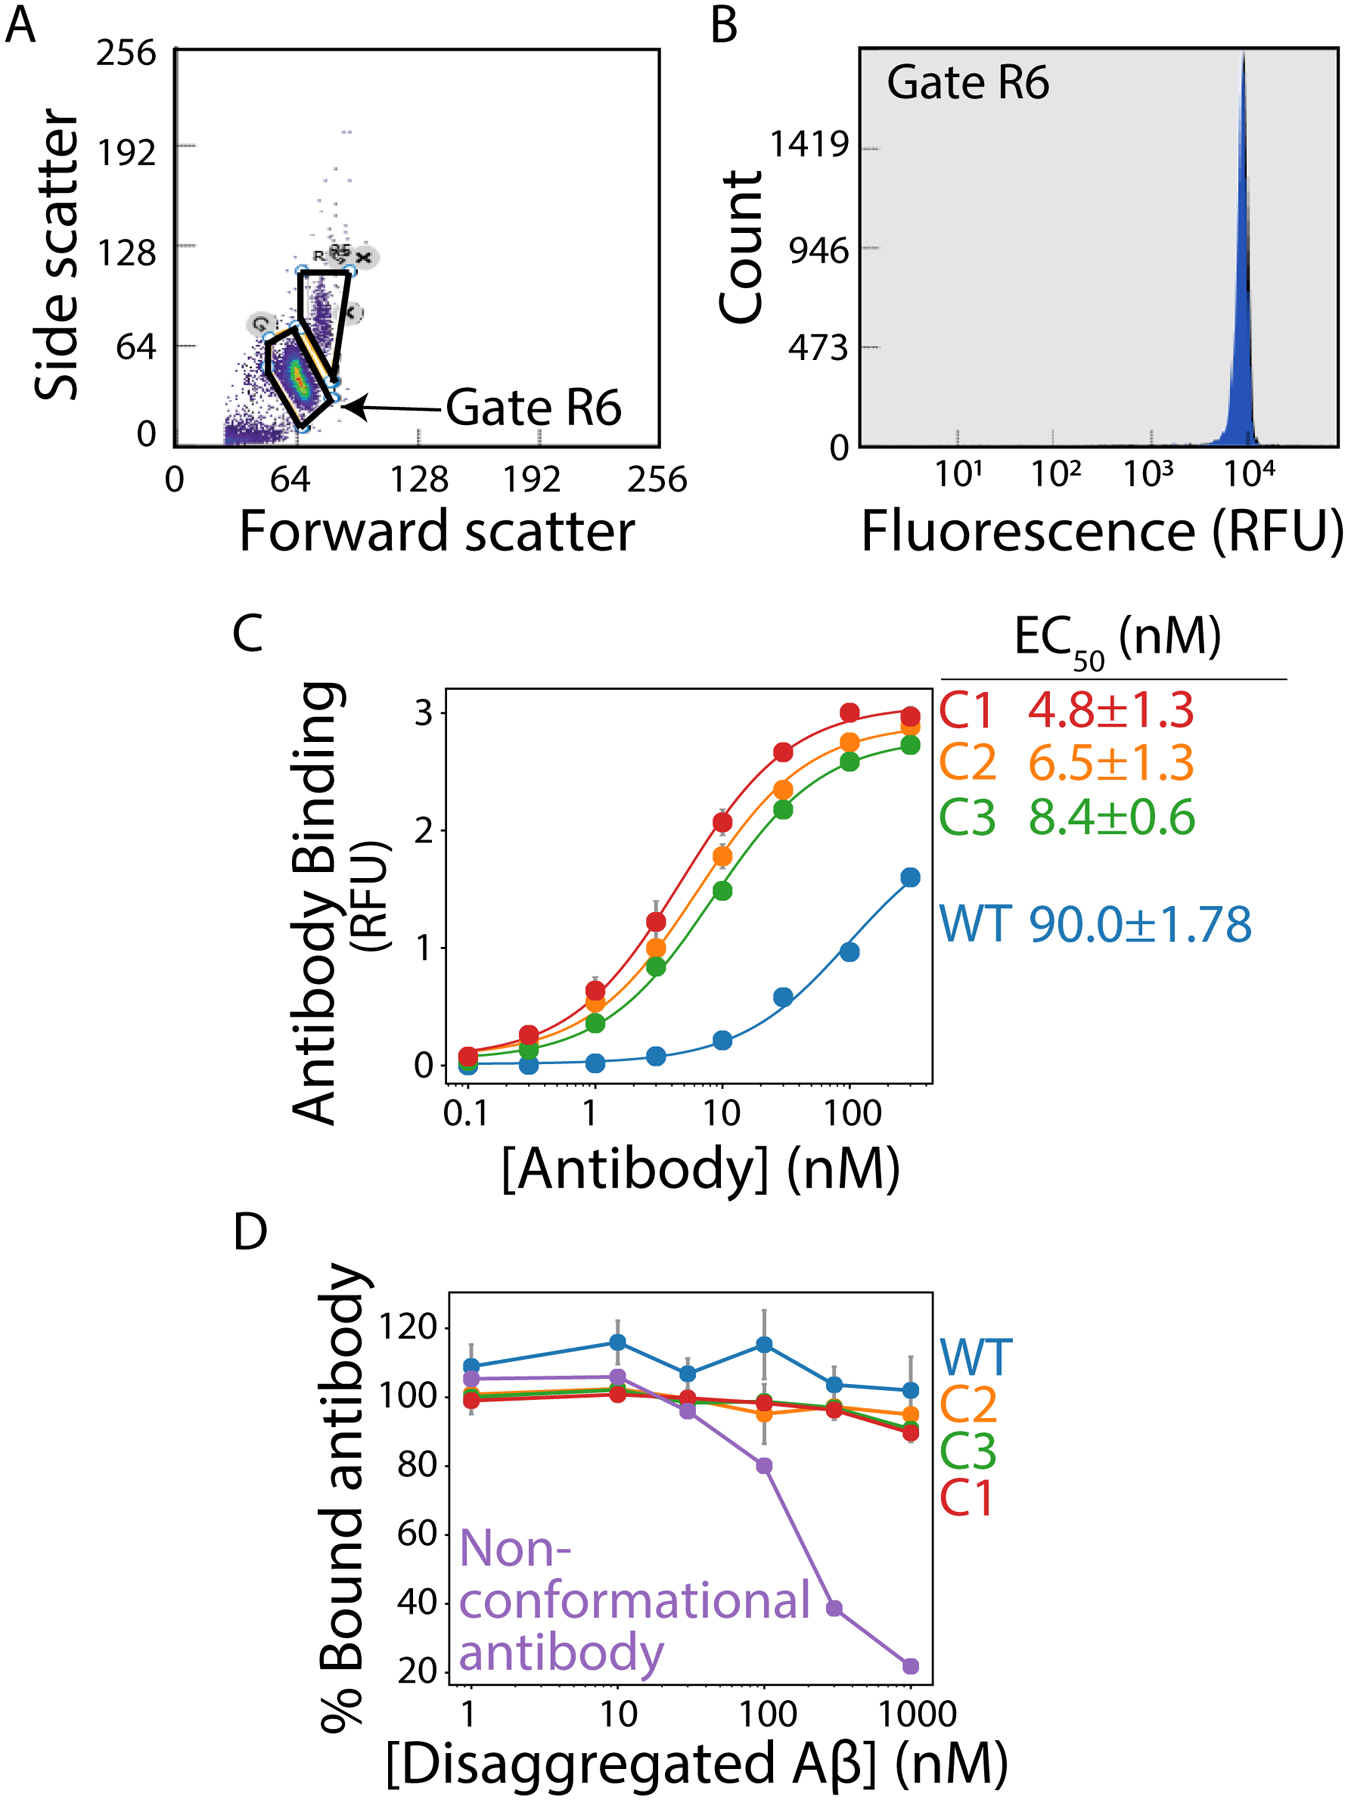
Figure 2. Flow cytometry-based analysis of antibody affinity and conformational specificity.

Amyloid fibrils are immobilized on micron-sized magnetic beads and binding of soluble antibodies is evaluated using flow cytometry. (A) Flow cytogram displaying forward scatter (488 nm) versus side scatter (488 nm) results, with the singlet population of fibril-coated beads highlighted in the R6 gate. (B) Histogram of the counts of binding events in the R6 gate as a function of the antibody binding signal detected via fluorescence measurements (647 nm). (C) Relative binding of antibodies to Aβ fibrils as a function of the concentration of wild-type (WT) and affinity-matured (C1, C2 and C3) antibodies. The results are mean signals from the histogram shown in (B). (D) Antibody binding to fibrils in the presence of disaggregated Aβ. Each antibody (30 nM) was pre-incubated with different concentrations of disaggregated Aβ, and then the antibodies were evaluated for their ability to recognize Aβ fibrils. A control (non-conformational antibody) displays decreased binding to immobilized fibrils as the concentration of disaggregated Aβ is increased.
