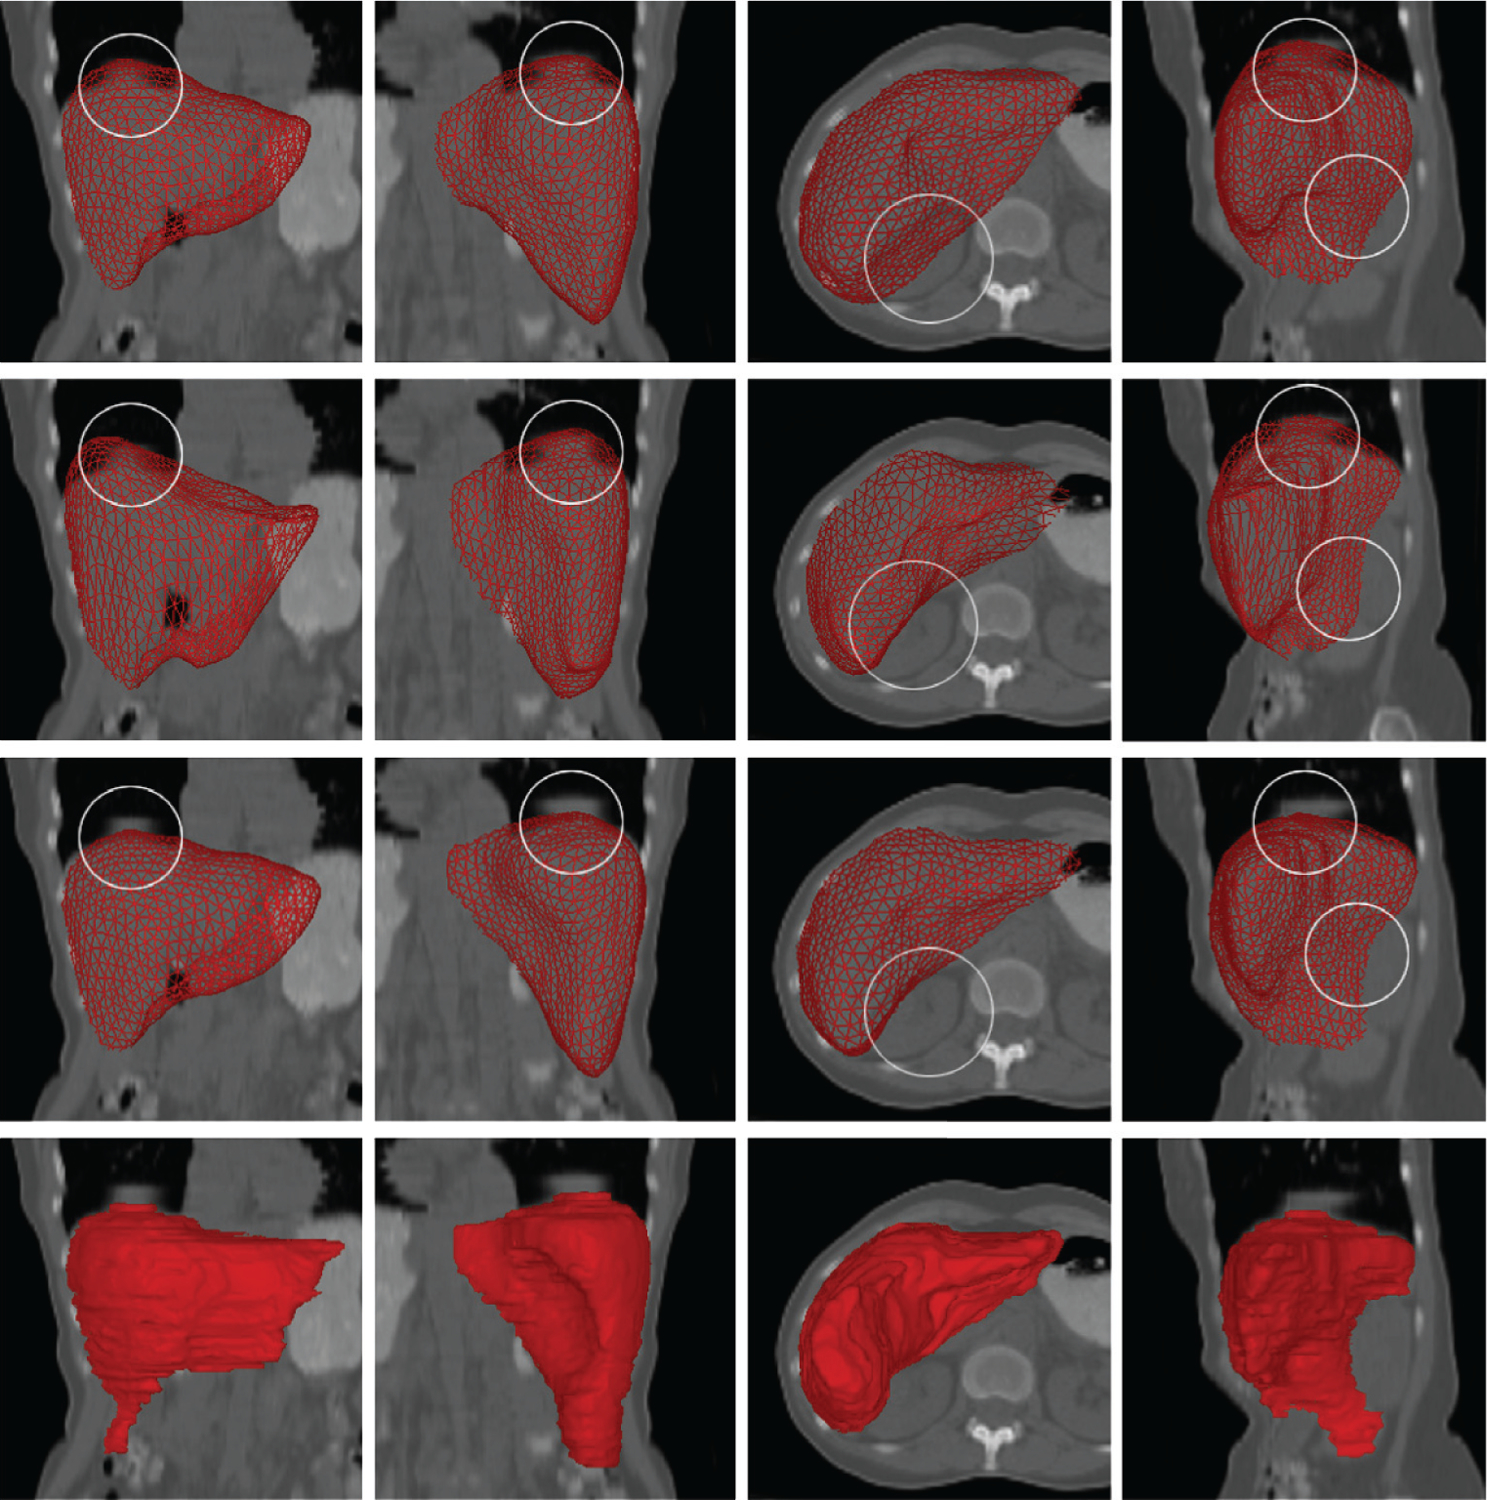
Figure 7.

Comparison between SSC liver segmentation from low-dose CT and segmentation approaches based on other shape models (all using the same training data). (First row) Procrustes analysis, rigid + scaling. (Second row) Thin-plate spline model using nonrigid deformation. (Third row) SSC and proposed algorithm. (Fourth row) Manual segmentation (ground truth). Note that the SSC results are closer to the ground truth. Areas marked by circles indicate differences where the other techniques failed, likely due to breathing artifacts. Each result was subsequently further deformed and refined. Abbreviations: CT, computed tomography; SSC, sparse shape composition. Figure adapted from Reference 98 with permission from Elsevier.
