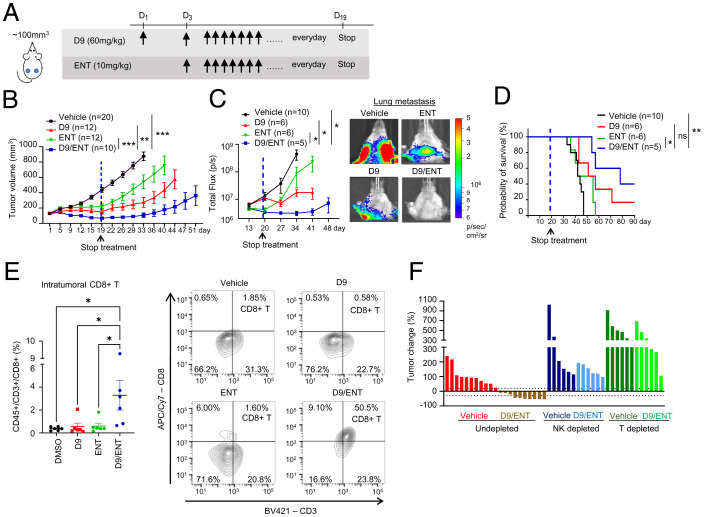
Fig. 4.
Combination of EZH2 and HDAC inhibitors suppresses tumor growth and metastasis in an immune-dependent manner. (A) Illustration of treatment dosage and schedule. Balb/c mice were treated with vehicle, 60 mg/kg D9, 10 mg/kg ENT, or combination of D9/ENT every day. (B) 4T1-HER2 primary tumor growth of Balb/c mice treated with vehicle, D9, ENT, or combination of D9/ENT. Blue dotted line indicates the day when the treatment was stopped. The number of subjects (n) per group were indicated in the graph. Data are expressed as means ± SEM of n number of samples. P values were calculated with Mann–Whitney unpaired t test, **P < 0.01, ***P < 0.001, ns, not significant. (C) Combination of D9 and ENT significantly reduced 4T1-HER2 lung metastasis compared to vehicle, D9 and ENT (Left). Representative bioluminescent imaging showing lung metastasis of 4T1-HER2 tumors on day 34 (Right). The number of subjects (n) per group were indicated in the graph. Data are expressed as means ± SEM of n number of samples. P value were calculated with Mann–Whitney unpaired t test, *P < 0.05. (D) Improved survival probability of 4T1-HER2 bearing mice treated with D9/ENT compared to vehicle and single treatment of D9 and ENT. The number of subjects (n) per group were indicated in the graph. P value were calculated with Logrank Mantel–Cox test, *P < 0.05, **P < 0.01, ns, not significant. (E) Percentage of tumor infiltrating CD8+ T cells (CD45+/CD3+/CD8+ population in whole tumor) assessed by flow cytometry following treatment at the end of experiments (Left). Each dot represents one individual tumor. Representative flow cytometric plots of CD3+/CD8+ T cells for each treatment group were shown (Right). Data are expressed as means ± SEM of six representative 4T1-HER2 tumors per group. P values were calculated with one-way ANOVA with Tukey’s multiple comparisons test, *P < 0.05. (F) Percentage of tumor change showing depletion of NK cells or T cells in Balb/c mice abolished the therapeutic effect of D9/ENT. Percentage of tumor change was calculated based on tumor volume on day 15 from the baseline of tumors before treatment. Each bar represents one individual tumor.

