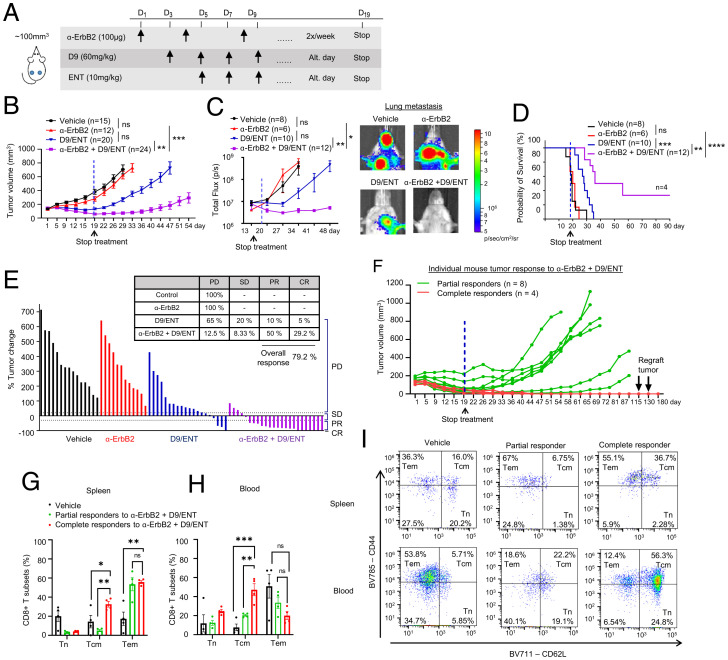
Fig. 6.
Combination of EZH2 and HDAC inhibitors sensitizes anti-HER2 therapy to induce complete tumor eradication and long-term immune memory. (A) Illustration of treatment dosage and schedule. Balb/c mice were treated with vehicle, 100 μg α-ErbB2, 60 mg/kg D9, and 10 mg/kg ENT, or α-ErbB2+D9/ENT. (B) Tumor volume along treatment in 4T1-HER2 tumor bearing Balb/c mice model which were treated with vehicle, α-ErbB2, D9, and ENT, or α-ErbB2+D9/ENT. Blue dotted line indicates the day when the treatment was stopped. The treatment schedule is indicated at the top of the plot. The number of subjects (n) per group are indicated in the graph. Data are expressed as means ± SEM of n number of samples. P value were calculated with Mann–Whitney unpaired t test, **P < 0.01, ***P < 0.001, ns, not significant. (C) Combination of D9 and ENT enhances α-ErbB2 treatment in reducing 4T1-HER2 lung metastasis compared to vehicle, α-ErbB2 and D9/ENT treatment (Left). Representative bioluminescent imaging showing lung metastasis of 4T1-HER2 tumors on day 34 (Right). The number of subjects (n) per group were indicated in the graph. Data are expressed as means ± SEM of n number of samples. P values were calculated with Mann–Whitney unpaired t test, *P < 0.05, **P < 0.01, ns, not significant. (D) Prolonged overall survival of 4T1-HER2–bearing mice treated with α-ErbB2+D9/ENT compared to vehicle, α-ErbB2, or D9/ENT. The number of subjects (n) per group were indicated in the graph. P values were calculated with Logrank Mantel–Cox test, **P < 0.01, ***P < 0.001, ****P < 0.0001, ns, not significant. (E) Percentage of tumor change showing the therapeutic effect of vehicle, α-ErbB2, D9/ENT, or combination. The percentage of tumor change was calculated based on day 22 from the baseline of tumors before treatment. Tumor volume changes were analyzed based on RECIST criteria to categorize the tumor response into progressive disease (PD). stable disease (SD), progressive repression (PR), and complete response (CR). Each bar represents one individual tumor. (F) Individual mouse tumors response (average volume of two tumors from left and right mammary fat pads) treated with α-ErbB2+D9/ENT. n represents the number of mice. Partial responders are defined as tumors that undergo relapse after treatment was stopped. Complete responders are tumors that completely disappear after treatment and continuously reject tumor growth. 4T1-HER2 tumors were reinoculated twice on day 115 and 130 to complete responders. (G) Flow cytometry analysis showing T cells compartment in spleen and (H) blood comparing between 4T1-HER2–bearing mice (vehicle) and mice achieving partial or complete response after α-ErbB2+D9/ENT treatment. CD8+ T cell subset population are defined by CD44−CD62L+ naïve T cell (Tn), CD44+CD62L− Tem and CD44+CD62L+ Tcm populations. Blood and spleen were collected at the end of the experiment. Data are expressed as means ± SEM of four 4T1-HER2 spleen or blood samples in each group. Each dot represents one individual sample. P values were calculated with two-way ANOVA with Tukey’s multiple comparisons test, *P < 0.05, **P < 0.01, ***P < 0.001, ns not significant. (I) Representative flow cytometry plots showing CD8+ T cell subset population for spleen (Upper) and blood (Lower) samples.

