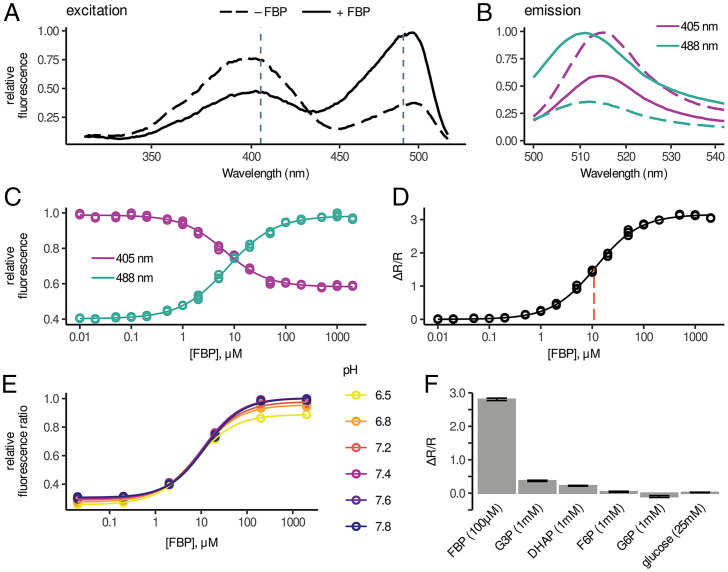
Fig. 2.
In vitro characterization of HYlight. (A) Excitation spectra from HYlight in the presence (solid) and absence (dashed) of 1 mM FBP. (B) Emission spectra from HYlight in the presence and absence of 1 mM FBP. Dashed lines indicate excitation set at 405 nm while solid lines indicate excitation set at 488 nm. (C) Normalized HYlight emission induced by excitation at 405 nm (purple) or 488 nm (cyan) as a function of FBP concentration. (D) Relative change of the fluorescence ratio (ΔR/R) resulting from 488- and 405-nm excitation as a function of [FBP]. (E) Fluorescence ratio as a function of pH across FBP concentrations. (F) Relative HYlight fluorescence ratio for FBP compared to other glycolytic metabolites. See also SI Appendix, Fig. S2.

