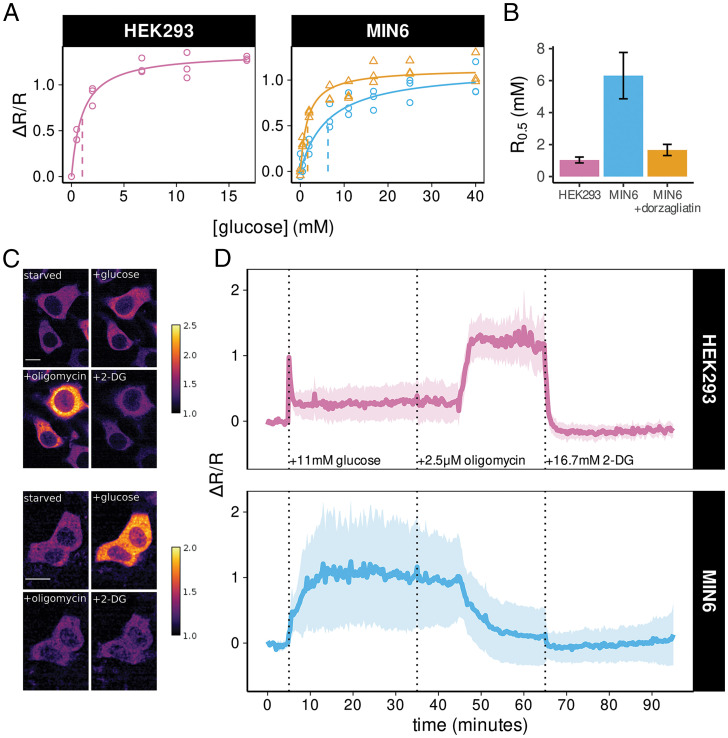
Fig. 3.
HYlight imaging reveals differences in metabolic phenotype between HEK293 and MIN6 cells. (A) HYlight fluorescence ratio as a function of glucose concentration follows Michaelis–Menten kinetics. Differences in the magnitude of maximal change and R0.5 are observed between HEK293 (purple), MIN6 (blue), and MIN6 cells treated with dorzagliatin (orange). Each point represents the median fluorescence ratio across cells measured by flow cytometry relative to cells incubated in 0 mM glucose. Lines indicate fitted Michaelis–Menten equation with R0.5 shown as a vertical dashed line. (B) Comparison of R0.5 estimates ± SE for HEK293 (1.0 ± 0.24 mM), MIN6 (6.4 ± 1.6mM), and MIN6 cells treated with 10 µM dorzagliatin (1.28 ± 0.22 mM). (C) Example of fluorescence ratiometric images in HEK293 cells (Upper) and MIN6 cells (Lower) after 1 h of glucose starvation and following addition of 11 mM glucose, 2.5 μM oligomycin, and 16.7 mM 2-DG. The scale bars in the photomicrographs represent 10 microns. (D) Quantification of the change in fluorescence ratio (ΔR/R) for HEK293 cells (Upper, n = 67 cells over 3 separate experiments) and MIN6 cells (Lower, n = 222 cells over 3 separate experiments) following the metabolic perturbations shown in C. ΔR/R was normalized to the glucose-starved state at the beginning of each experiment. Solid line represents the mean across cells while shaded ribbon represents the mean ± SD. In MIN6 cells, oscillations around the mean contribute to the increased cell-to-cell variability in fluorescence ratio over time. See also SI Appendix, Fig. S3.

